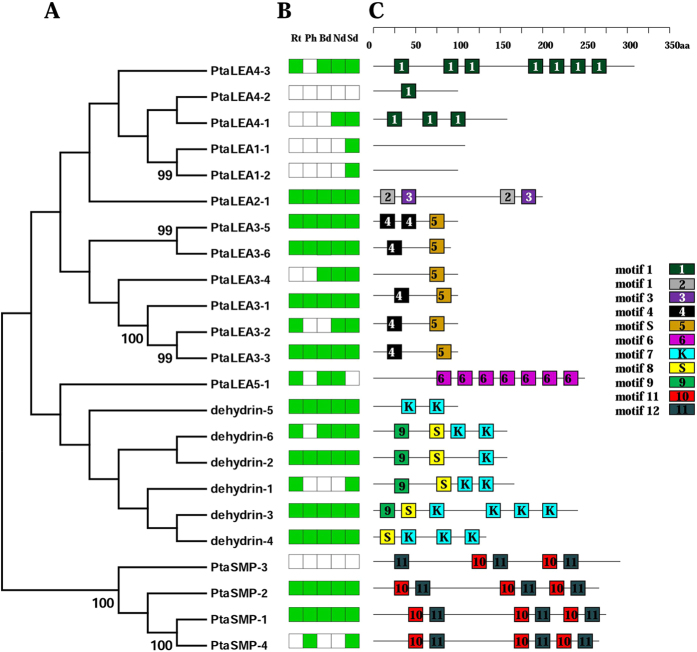
Figure 2.
Phylogenetic relationships (A), expression patterns (B) and motif structure of P. tabuliformis LEAs. In B, the green box indicates positive detection of gene expression in the corresponding tissue under root (Rt), phloem (Ph), bud (Bd), needle (Nd), two weeks germinants (Ge). In C, boxes labeled with numbers are protein motifs; the motif sequences are provided in the supplemental Fig. 1.

