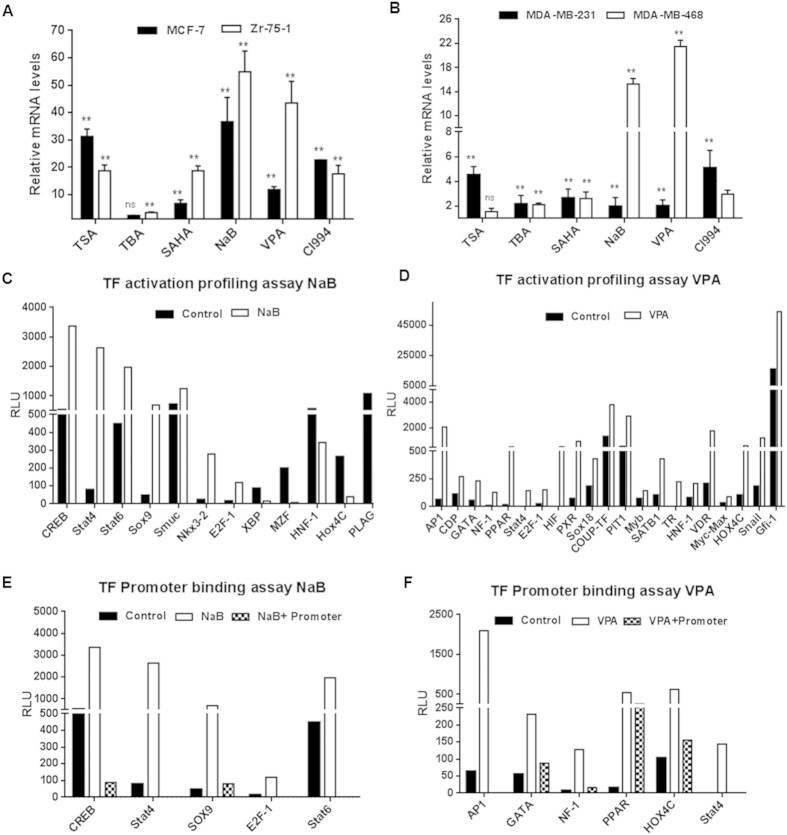
Figure 2. Induction of endogenous NIS transcript after HDACi treatment in BC cell lines.
(A,B) MCF-7, MDA-MB-231, Zr-75-1 and MDA-MB-468 cells treated with different HDACi for 48 hours were evaluated for NIS mRNA by real-time PCR using ABI probe. Results were normalized for housekeeping gene GAPDH and presented as relative fold differences to untreated control (**indicates high significance p < 0.005, ns indicates non-significant). (C,D) Graphs showing activation of transcription factors (TFs) post NaB (C) or VPA (D) treatment in MCF-7 cell line. TFIID was used for normalization as per manufacturer’s guideline. Candidate TFs showing greater or lesser than 1.5 folds difference in luminescence read-outs after normalization (threshold cut-off) were plotted. (E) Graph represents TF binders to human NIS promoter upon NaB treatment identified by promoter binding array. In comparison to drug treated nuclear extract samples, when NIS promoter is added, the luminescence read-out is lowered due to competitive binding to the promoter. Candidates like CREB, Stat4, Stat6, Sox9 and E2F-1 showed significant binding efficiency to the promoter. (F) TF binders identified such as AP1, GATA, NF-1, PPAR, Hox4C and Stat4 upon VPA treatment using the same array.

