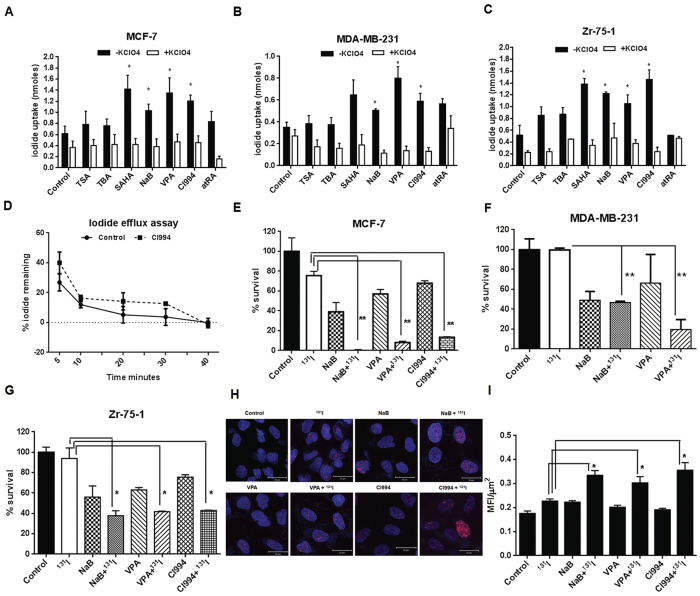
Figure 4. Modulation of NIS function by HDACi in BC cells.
(A–C) Effect of the HDACi drugs and atRA on NIS-mediated iodide accumulation in MCF-7, MDA-MB-231 and Zr-75-1 cells respectively. 30 μM potassium perchlorate was used for blocking iodide uptake. The Y axis scale bars represent nanomoles (nmoles) of iodide uptake after 48 hours of HDACi and atRA treatment of cells. Error bars indicate standard error of mean. (D) Chart showing iodide efflux assessment done using MCF-7 cells. CI994 drug was used as a candidate HDACi representative to verify change in efflux upon drug treatment. (E–G) Charts represent measure of percentage cell survival after selective killing by 131I treatment in the presence or absence of candidate HDACi treatment as marked. MCF-7, MDA-MB-231 were exposed to 50 μCi/ml of 131I and Zr-75-1 cells were exposed to 100 μCi/ml of 131I with or without pre-treatment of NaB/ VPA/ CI994. Cell survival was measured by their colony forming ability (**indicates high significance p < 0.005). (H) Immunofluorescence photographs showing DNA damage response after 131I exposure detected by γ-H2Ax foci formation. Zr-75-1 cells were exposed to 100 μCi/ml 131I with or without pre-treatment of NaB/ VPA/ CI994 and probed with γ-H2Ax antibody after fixation. Foci were detected by Dylight 633 secondary antibody (red). Cell nuclei were cross stained using DAPI (blue). Scale bar represents 20 μm. (I) Graph showing MFI/μm2 of foci formation after 131I exposure with or without HDACi pre-treatment. Average MFI of 35 cells was calculated using LSM image browser and plotted.

