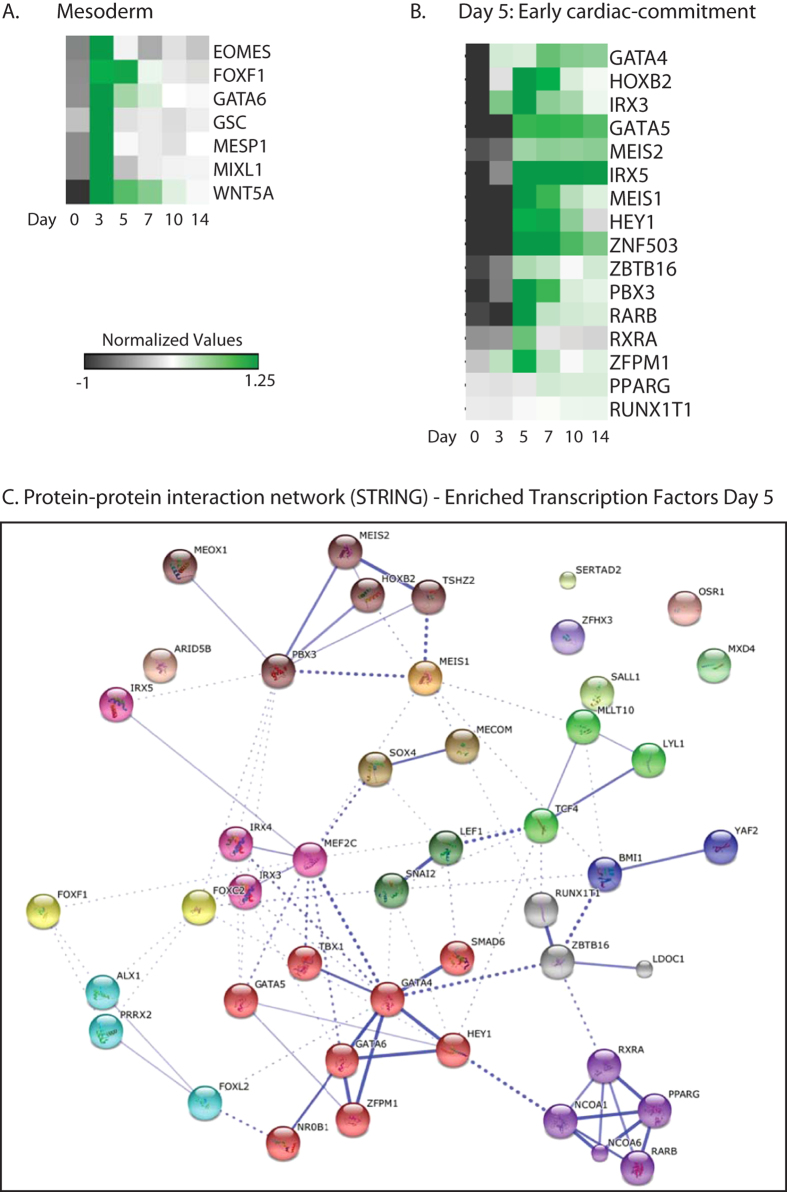
Figure 3.
(A) Heatmap visualization of the relative expression levels of mesoderm genes throughout cardiac differentiation, showing a stage-specific enrichment in MESP1-mCherry isolated progenitors at day 3 of differentiation. Heatmap shows averaged values from n = 3. (B) Relative expression levels of DNA binding transcriptional regulators that were enriched at day 5 of differentiation in the MESP1-mCherry positive derivatives. Genes were clustered based on a One Minus Pearson Correlation. Heatmap shows averaged values from n = 3. (C) Evidence for protein-protein interaction networks of enriched transcription factors at day 5 of differentiation was constructed by STRING. Interactions with a medium confidence >0.4 are visualized. Proteins are clustered using the MCL algorithm. Every color represents a cluster. Inter-cluster edges are represented by dashed lines.

