
Figure 5. Profile Plots of Day 5 and Day 7 Enriched Transcription Factors.
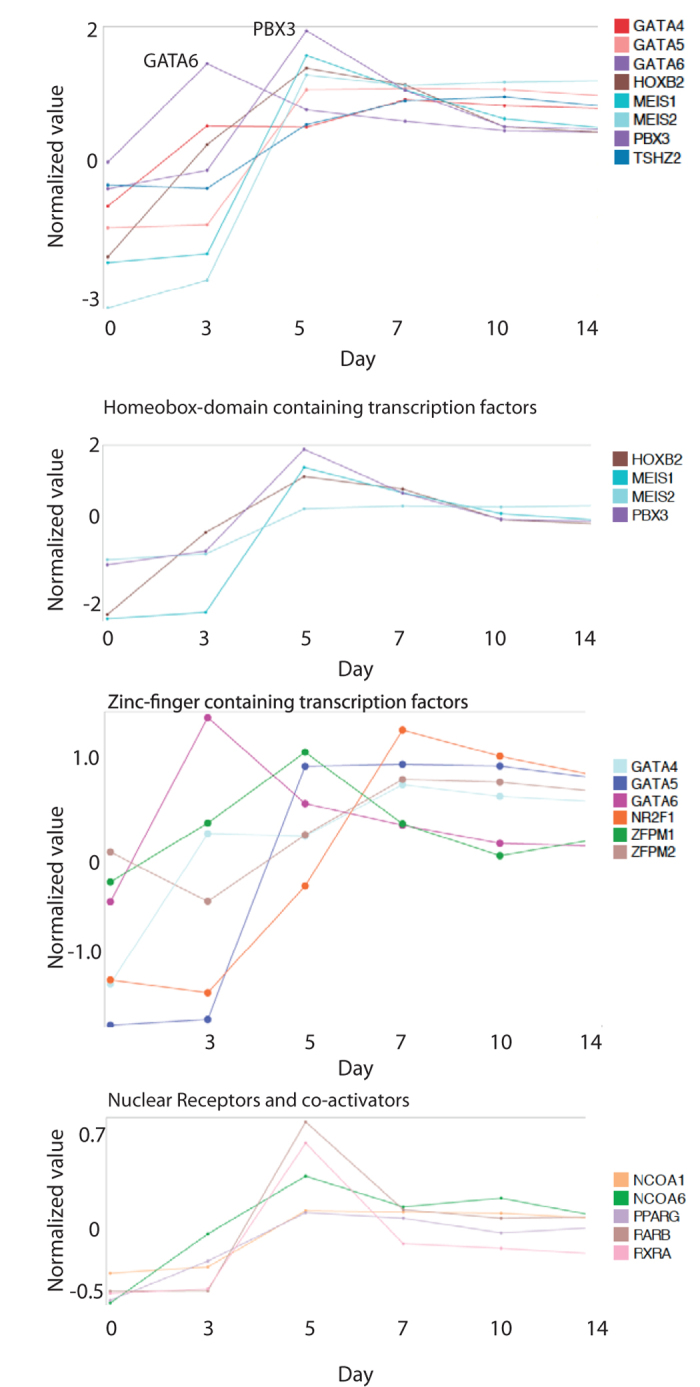
The upper panel shows the expression patterns upon cardiac differentiation of a selection of DNA binding transcription factors. The second upper panel shows the similarities between the expression patterns of HOXB2, MEIS1, MEIS2, and PBX3. The second last panel shows the expression pattners of GATA factors and ZFPM factors, and shows the similarities between ZFPM2 and GATA4 from day 7–14 of differentiation. The lower panel shows the expression levels of retinoic acid nuclear receptors and their co-activators, peaking at day 5 of differentiation. Normalized alues are visualized on a global expression scale and averaged from n = 3 at each timepoint.