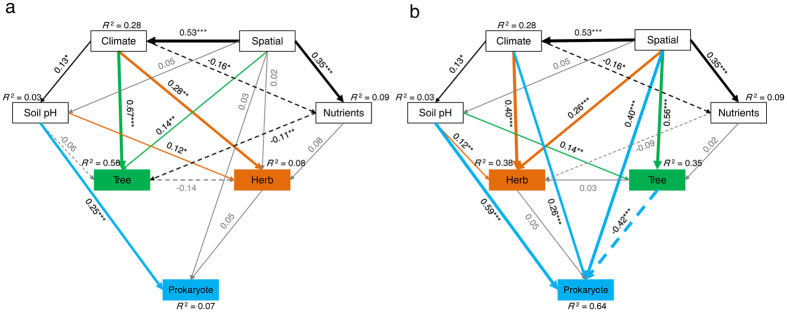
Figure 3.
Effects of spatial factors, climate, soil pH and nutrients on alpha (a) and beta diversity (b) variance of trees, herbs and soil prokaryotes. Nutrients include total nitrogen, soil organic carbon, and available phosphorus. Continuous arrows indicate positive effect while dashed arrows indicate negative effect. The width of the arrows represents the strength of the influence. Goodness-of-fit statistics are evaluated as follows: (Fig. 3a) χ2 = 5.4, P = 0.25, d.o.f. = 4, RMSEA = 0.04, AIC = 53.4, GFI = 0.996); (Fig. 3b) χ2 = 5.4, P = 0.14, d.o.f. = 3, RMSEA = 0.05, AIC = 55.4, GFI = 0.997. Significant level: *P < 0.05, **P < 0.01, ***P < 0.001. (d.o.f, degrees of freedom; RMSEA, root mean square error of approximation; AIC, Akaike information criterion; GFI, goodness fit index).

