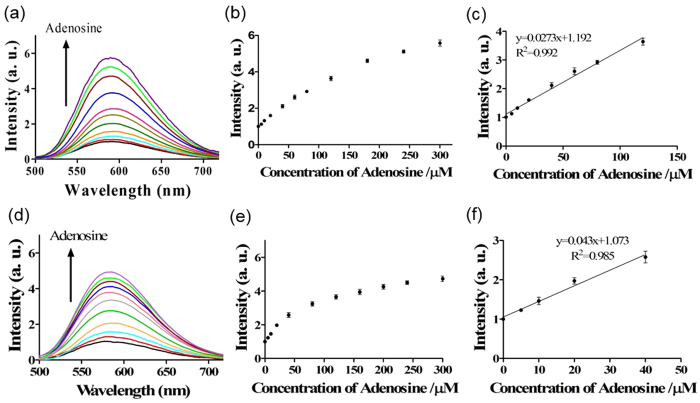
Figure 5.
(a) Luminescence spectra of the system (Route A) in response to various concentrations of adenosine: 0, 5, 10, 20, 40, 60, 80, 120, 180, 240 and 300 μM. (b) The relationship between luminescence intensity at λ = 590 nm and adenosine concentration (Route A). (c) Linear plot of the change in luminescence intensity at λ = 590 nm vs. adenosine concentration (Route A). Error bars represent the standard deviations of the results from three independent experiments. (d) Luminescence spectra of the system (Route B) in response to various concentrations of adenosine: 0, 5, 10, 20, 40, 60, 80, 120, 180, 240 and 300 μM. (e) The relationship between luminescence intensity at λ = 590 nm and adenosine concentration for (Route B). (f) Linear plot of the change in luminescence intensity at λ = 590 nm vs. adenosine concentration (Route B). Error bars represent the standard deviations of the results from three independent experiments.

