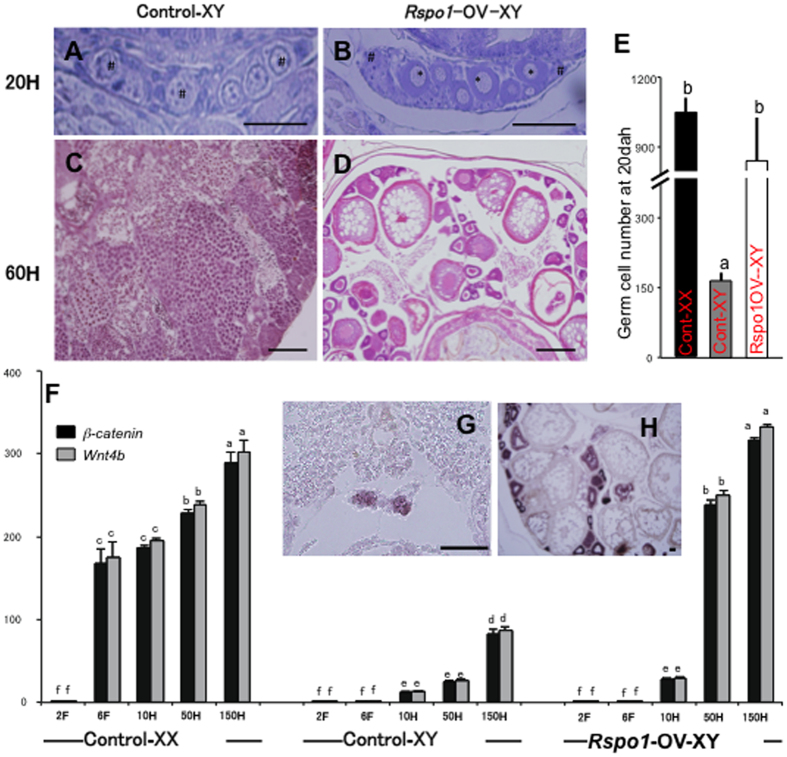
Figure 3. Effects of Rspo1 overexpression on ovarian morphology and Wnt4b/β-catenin signaling.
(A,C) Testis of control XY fish at 20 (A) and 60 (C) dah. (B,D) Ovaries of Rspo1-OV-XY fish at 20 (B) and 60 (D) dah. The mitotic and meiotic germ cells are marked with “*” and “#” respectively. (E) The graphical representation of total germ cells count at 20 dah in different fish groups. Excessive germ cell proliferation was observed in both control-XX (n = 10) and Rspo1-OV-XY (n = 10) gonads at 20 dah. Significant differences (marked by different letter) were detected between control-XY (n = 10) and Rspo1-OV-XY fish. (F) Wnt4b and β-catenin expression in control XX, control XY, and Rspo1-OV-XY fish at different stages of development. Marked increase in the expression of Wnt4b and β-catenin in Rspo1-OV-XY fish were detected at 50 and 150 dah. Data are shown as mean ± S.E., and expressed as relative abundance corrected for Ef1α. Different letters above the bars indicate that these groups differ significantly from each other at p < 0.01. (G,H) Rspo1-OV-XY fish shows β-catenin expression in small germ cell or oocytes and their surrounding cells at 6 (G) and 150 dah (H). Note: Scale bar-50 μm.

