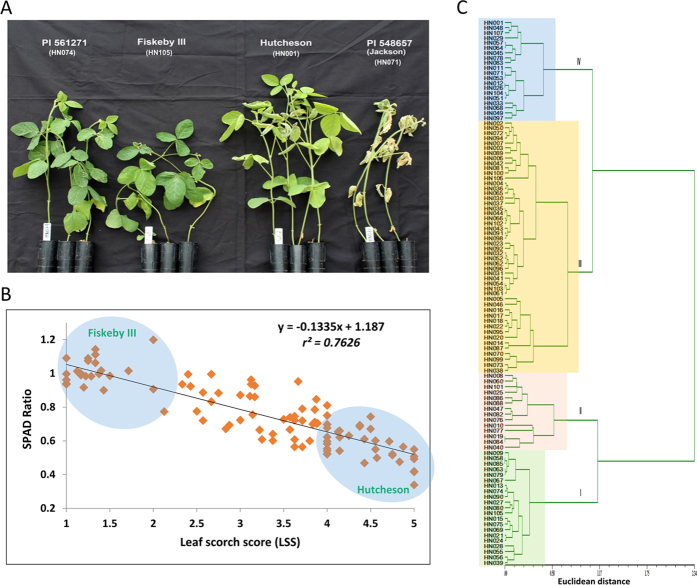
Figure 1. The phenotypic evaluation for salinity tolerance.
(A) Effect of salt treatment (120 mM NaCl) on four diverse genotypes after 1 week of treatment under greenhouse conditions. Fiskeby III (HN105, salt-tolerant control), Hutcheson (HN001, salt-sensitive control) along with PI 561271 (HN074) and PI 548657 (HN071) showed a high level of tolerance and sensitivity out of 104 germplasm lines tested, respectively. (B) Correlation coefficients of leaf scorch score (LSS) and SPAD ratio were calculated from 104 soybean genotypes evaluated for salt tolerance. The highlighted circle shows the most tolerant and sensitive genotypes. (C) Dendrogram showing phenotypic (LSS and SPAD ratio) variability relationship between 104 soybean accessions based on phenotypic data. The Euclidean distance (horizontal axis) between objects is used as the distance measure; the clustering was performed using NTSYS software.

