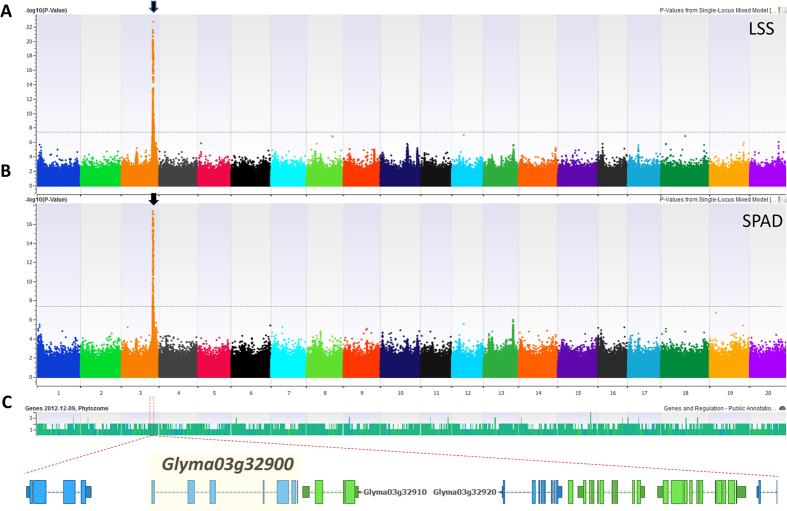
Figure 2.
Manhattan plots of GWAS for (A) LSS and, (B) SPAD ratio, in 106 soybean lines using WGRS dataset. Negative log10-transformed P values of SNPs from genome-wide scan for salinity traits using EMMAX model including kinship and population structure are plotted against positions on each of the 20 chromosomes; (C) genes underlying significant trait-associated SNPs on Chr. 3. The horizontal line denotes the calculated threshold value for declaring significant association.

