
Figure 3. Hierarchical clustering of 129 diverse lines based on SNP information of WGRS data.
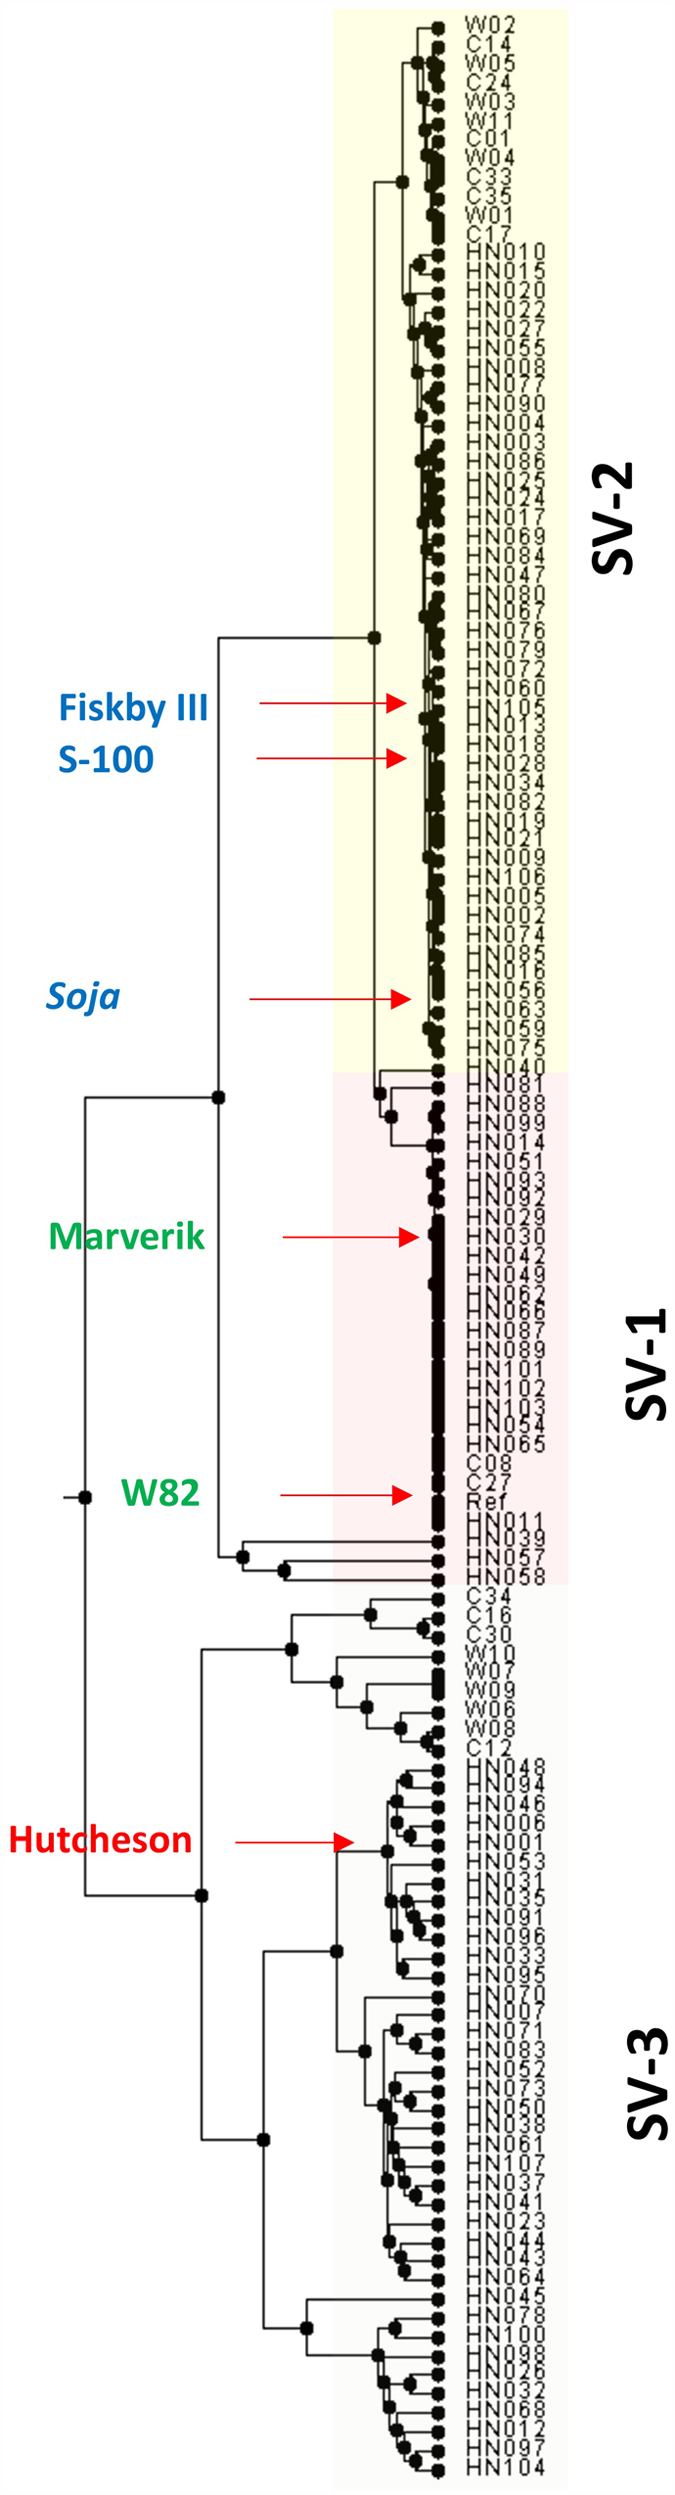
Clusters were observed in 23 lines44 [denoted with ‘C’ and ‘W’] and 106 lines [denoted with ‘HN’]. Lines representing structural variation are highlighted with different colors (see details in Fig. 4A). Lines with known salinity reaction are shown with pointed arrow in each group.