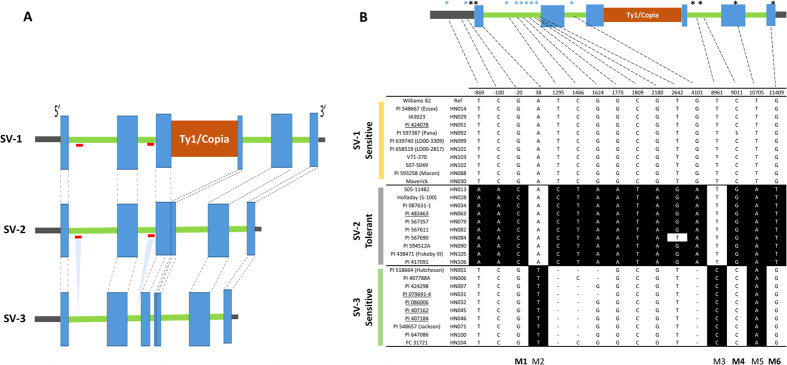
Figure 4.
(A) Structural variation in the GmCHX1 gene. Blue box represents exon, green bar represents intron, brown box represents insertion of Ty1/Copia transposon in exon 3, and gray bar represents 3′ and 5′ UTR. Dotted lines indicate the exon position. Red lines indicate that this region is deleted in SV-3 (Valliyodan et al. unpublished). (B) Schematic graph shows the position of SNP/Indels at for the GmCHX1 (40621077-40634451) gene. For clear visualization, 10 genotypes from each SV group were selected (for all other lines see Supplementary Table S3). SNP in back background are different from the reference genome (W82). The asterisk (*) above gene structure represents the approximate position of the SNP. SNPs used for the KASPar assay is denoted by black asterisk. The number above the SNP matrix shows position from start codon. PI line with underline represents wild soybean genotypes (G. soja).

