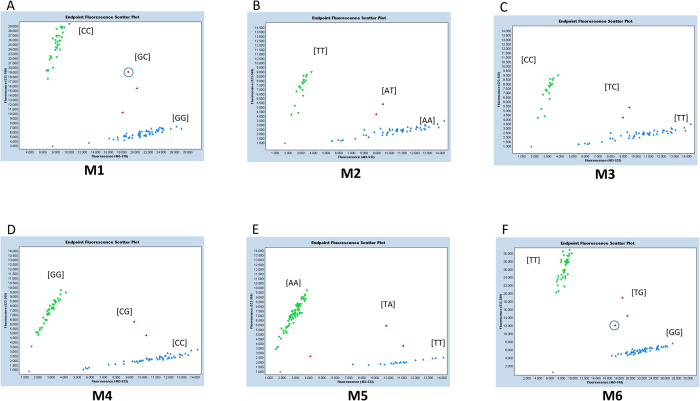
Figure 5. Sample genotyping plots of a diverse set of 106 WGRS lines and F8 RILs from population (PI 483463 x Hutcheson).
Plots generated from Roche 480 II software during KASPar assay genotyping of M1-M6 SNP markers. A-E: KASPar SNP graphs of 106 diverse soybean lines. F: KASPar SNP graph of RIL population. Genotype signal: Green- Mutant, Red- Heterozygote, Blue- WT (W82), Grey- Non template control. Heterozygote signal highlighted by circle represents artificial heterozygote.

