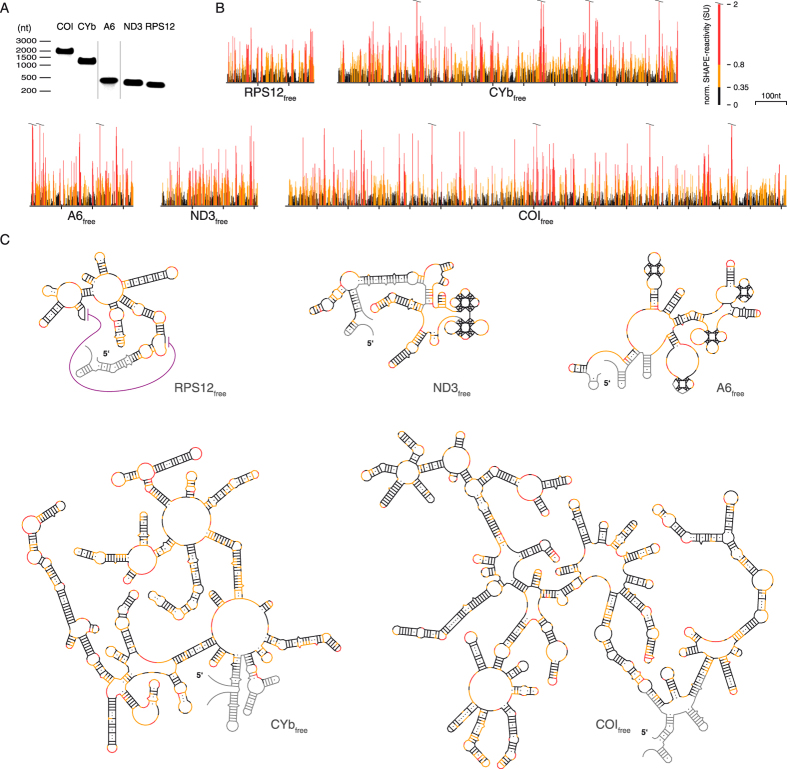
Figure 1. SHAPE-derived 2D-structures of T. brucei mitochondrial pre-mRNAs in their free folding states.
(A) Gel electrophoretic characterization of the T. brucei COI-, CYb-, A6-, ND3- and RPS12-transcripts. (B) Normalized SHAPE-reactivity profiles of all 5 transcripts as free RNAs. Black: low (<0.35SU); yellow: medium (0.35 ≤ SU < 0.8); red: high (≥0.8SU) normalized SHAPE-reactivities. SU: SHAPE-unit. nt: nucleotides. A representative example of the individual steps to generate normalized SHAPE-profiles is given in Supplementary Fig. 2. (C) SHAPE-derived MFE-2D-structures of the 5 transcripts in their free folding states (coloring scheme as above). Purple line: pseudoknot fold in the RPS12-transcript. Grey: plasmid-derived 5′- and 3′-nt extensions or no data.

