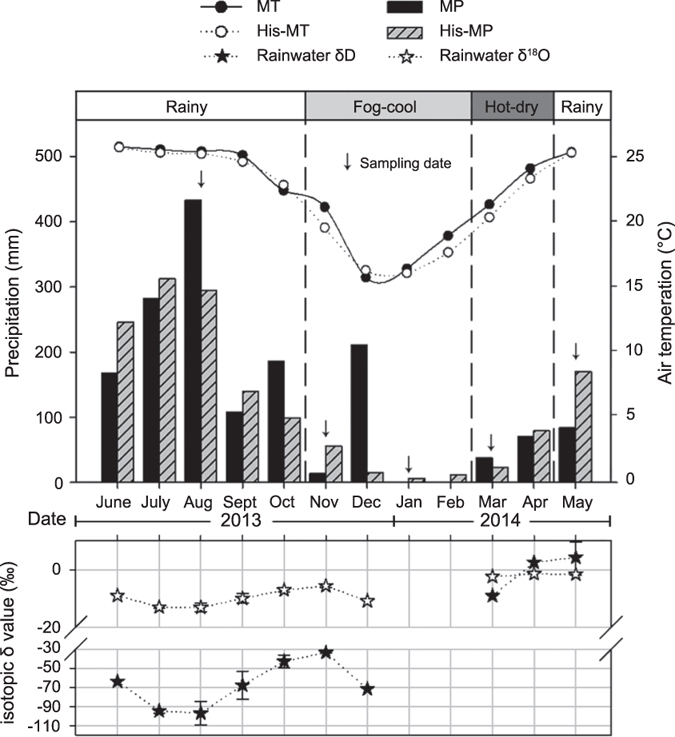
Figure 1. Monthly precipitation distribution and mean air temperature during the investigation period (historical data from XTBG ecological station).

MT indicates monthly mean air temperature, and His-MT indicates historical monthly mean air temperature from 1969 to 2014; MP indicates monthly precipitation, and His-MP indicates historical monthly precipitation from 1969 to 2014. The stippled bars at the top of the panel indicate the season. Vertical arrows indicate the sampling date.
