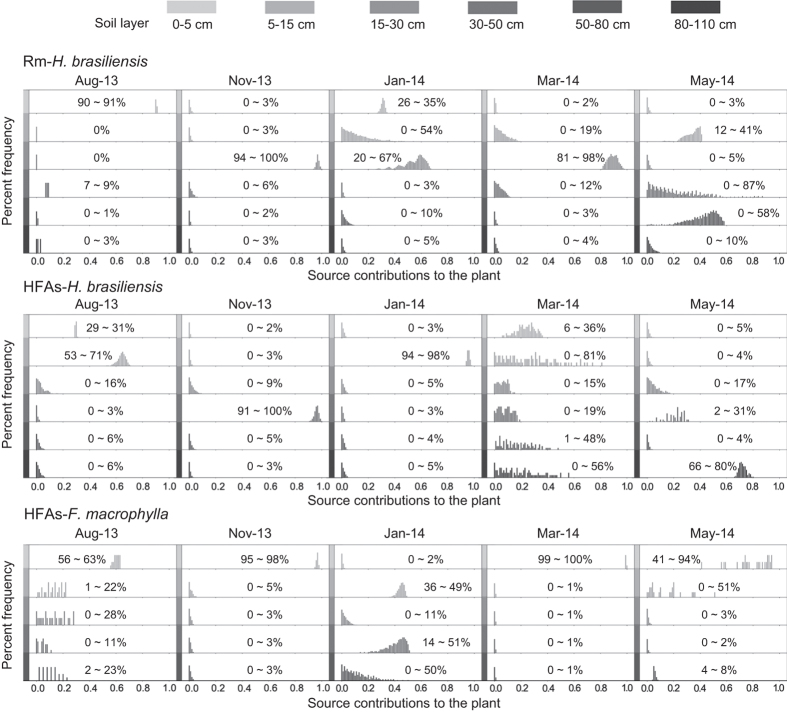
Figure 5. Relative water use for various sources for rubber trees and interplanted species at both sites during the investigation.
The contributions were calculated for all model iterations (in 1% increments), and are expressed as percent frequencies of all possible solutions. The range of potential water source contributions is labeled. The stippled bars at the top of the panel indicate soil layers of different depths. Rm indicates rubber monoculture, HFAs indicates Hevea-Flemingia agroforestry system.

