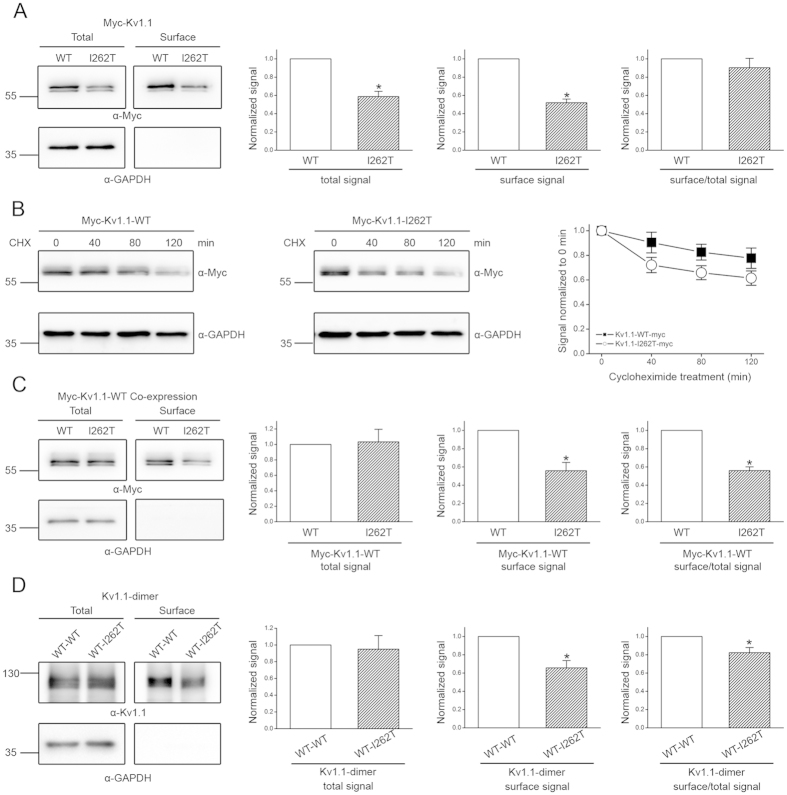
Figure 3. Biochemical analyses of the mechanism underlying the dominant-negative effect of I262T.
(A) Surface biotinylation analyses of Myc-tagged Kv1.1 (Myc-Kv1.1) WT and I262T in HEK293T cells. (Left) Representative immunoblots. The molecular weight markers (in kilodaltons) are labeled to the left, and the immunoblotting antibodies (α-Myc and α-GAPDH) are specified below the immunoblots. Cell lysates from biotinylated intact cells were either directly employed for immunoblotting analyses (total) or subject to streptavidin pull-down before being used for immunoblotting analyses (surface). (Right) Quantification of total protein level (total signal), surface protein level (surface signal), and surface expression efficiency (surface/total signal). I262T shows reduced protein level. The total protein density was standardized as the ratio of total Myc signal to the signal of the loading control GAPDH. The surface protein density was standardized as the ratio of surface Myc signal to the cognate total GAPDH signal. The efficiency of surface presentation is expressed as surface protein density divided by the corresponding standardized total protein density. (B) The kinetics of Myc-Kv1.1-WT and Myc-Kv1.1-I262T protein degradation in the presence of 100 μg/ml cycloheximide (CHX) treatments of different durations. (Left) Representative immunoblots. (Right) Quantification of Kv1.1 protein degradation time course. Protein densities were standardized as the ratio of Kv1.1 signals to the cognate GAPDH signals, followed by normalization to those of the corresponding control at 0 hr. See Supplementary Fig. S3 for details on semi-logarithmic linear-regression analyses of the degradation time course. (C) Surface biotinylation analyses of Myc-Kv1.1-WT co-expressed with untagged WT or I262T (1:1 molar ratio). (D) Surface biotinylation analyses of Kv1.1 WT-WT dimer and WT-I262T dimer. Kv1.1 dimers were detected with the anti-Kv1.1 (αKv1.1) antibody. Asterisks denote significant difference from the WT control (*, t-test: p < 0.05; n = 3–6). The gels were run under the same experimental conditions. Uncropped images of immunoblots are shown in Supplementary Fig. S5.

