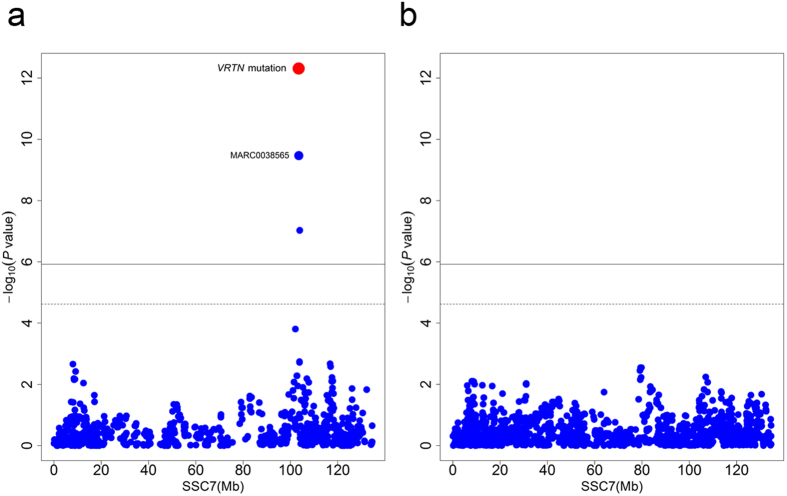
Figure 2. Regional association plot for the number of teats in the Duroc population.
(a) Association of the VRTN mutation and 60K chip SNPs on SSC7 with the number of teats in the Duroc population. Negative log10 P values of the quantified SNPs were plotted against their genomic positions. The red dot represents the VRTN mutation, and the top GWAS chip SNP (MARC0038565) is indicated. The solid and dashed lines indicate the 5% genome-wide and chromosome-wide Bonferroni-corrected thresholds, respectively. (b) When the VRTN mutation was include as a fixed effect in the GWAS model, no other SNP on SSC7 showed association signal.

