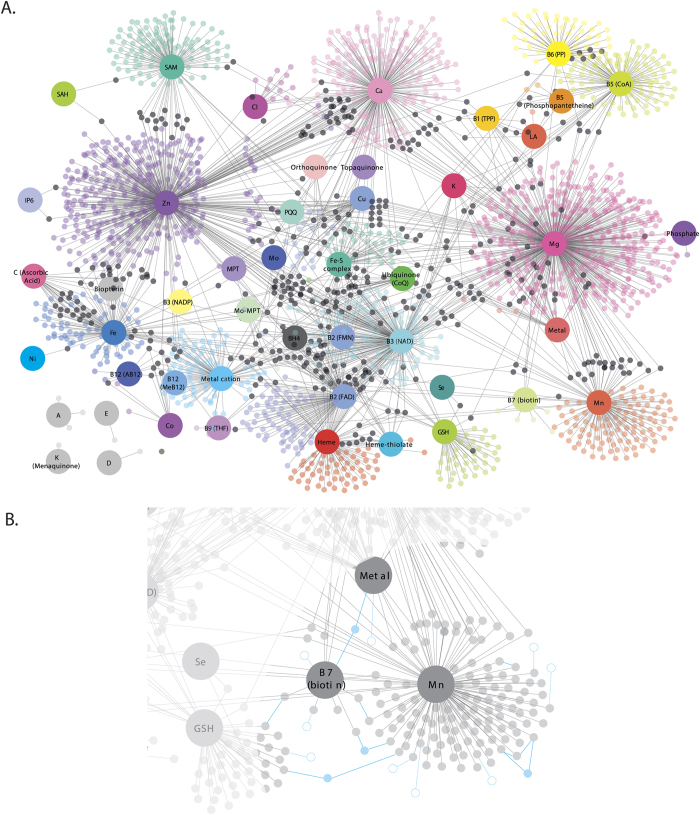
Figure 2. Cofactor-protein interaction network.
(A) Larger nodes represent cofactors while smaller nodes represent proteins. The nodes are color-coded by cofactors where smaller black nodes represent proteins that interact with more than one cofactor. (B) Schematic representation of first-degree neighbors. Dotted nodes and edges represent first-degree neighbors interacting with only one cofactor-protein (not considered in analysis) while solid nodes and edges represent first-degree neighbors that are shared by at least two cofactor-interacting proteins (considered in analysis). Note that first-degree neighbors were not represented in (A) for ease of visualization. Abbreviations: AB12: Adenosylcobalamin, AMP: Adenosine monophosphate, BH4: Tetrahydrobiopterin, CoA: Coenzyme A, CoQ: Coenzyme Q, FAD: flavin adenine dinucleotide, Fe-S: Iron-Sulfur complex, FMN: Flavin mononucleotide, GO: Gene ontology, GSH: Glutathione, HPA: Human protein atlas, LA: Lipoic acid, LMIC: Low- and middle-income countries, MeB12: Methylcobalamin, MPT-Mo: Molybdopterin-Molybdenum, MPT: Molybdopterin, MTHF: Methyltetrahydrofolate, NAD: Nicotinamide adenine dinucleotide, NADP: Nicotinamide adenine dinucleotide phosphate, PP: Pyridoxal phosphate, PPI: Protein-protein interaction, PQQ: Pyrroloquinoline quinone, SAM: S-Adenosyl methionine, THF: Tetrahydrofolate, TPP: Thiamine pyrophosphate, VDR: Vitamin D receptor, and Vit: Vitamin.

