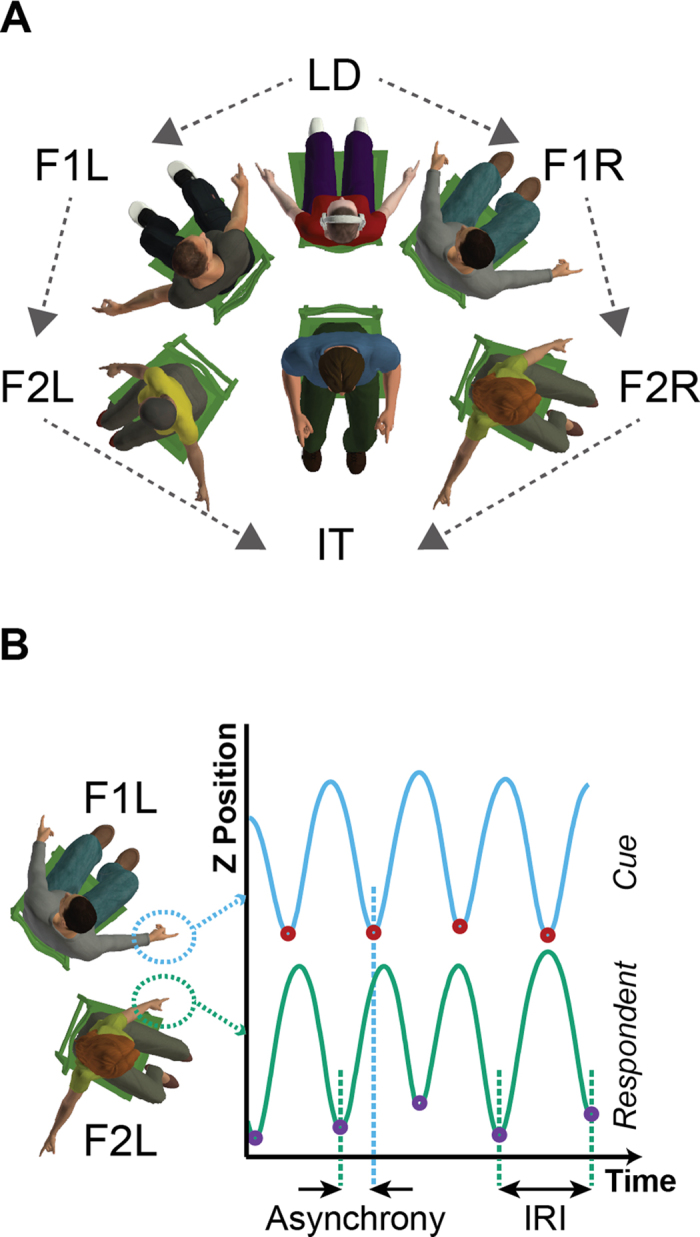
Figure 1.

(A) Layout of positions. Six participants were seated in one of six positions, assigned randomly and rotated across trials. Participants seated in the lead position (LD) were instructed to synchronise up and down arm movements with an auditory metronome, presented over headphones. Participants who were sat in positions F1L and F1R were defined as Followers and instructed to synchronise their movements with the left and right arm movements of LD, respectively. Similarly, F2L synchronised their movements to F1L and F2R with F1R. Finally, participants in the Integrator position, IT, were set slightly back so they were able to observe and synchronise their own arm movements with those of both F2L and F2R simultaneously. Dashed arrows indicate the direction of information flow from LD round to IT (figure by Mark T. Elliott). (B) Data Analysis. A video motion capture system was used to track markers on the fingertips of each participant. Movement trajectories were subsequently measured in the vertical (Z) axis. Peak detection algorithms were applied to the trajectories to extract the times of the minimum positions of the movements (‘event times’, shown by circles). Pairwise comparisons were applied between each position and the adjacent position (or the metronome for position LD). In the example, we compare the event times from the left arm of position F2L (respondent, green trajectory) with that from the right arm of position F1L, who is providing the timing information (cue, light blue trajectory). Asynchrony is calculated as the difference between the event time of the respondent and the closest event time from the cue. A negative asynchrony indicates the respondent’s event time occurred earlier than the cue. The inter-response interval (IMI) is calculated as the duration between the respondent’s consecutive event times.
