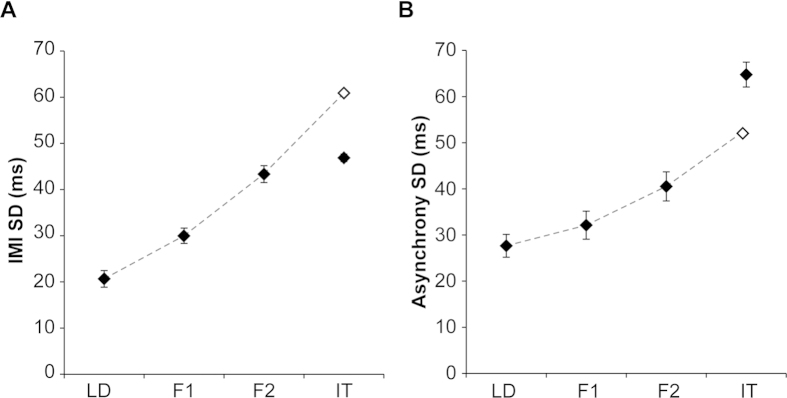
Figure 2.
(A) IMI Variability. Variability in the movement intervals of participants increased as they were positioned further down the chain. However, in the IT position participants no longer showed a significant increase in IMI SD. Dashed line shows a polynomial fit (order 2) based on the points LD, F1 and F2 only. The open-diamond marker shows the predicted IMI SD for the IT position if the same timing strategies were applied as in positions LD-F2. Filled-diamonds show the actual data points – note the IT data marker is much lower than predicted. Error bars show standard error of the mean (SEM). (B) Asynchrony Variability. The variability of the asynchronies between each position and the adjacent position were calculated. Asynchronies increased further down the chain, albeit more gradually than that observed for IMI variability. However, in the IT position participants showed a substantial increase in their Asynchrony SD. Dashed line shows a polynomial fit (order 2) based on the points LD, F1 and F2 only. The open-diamond marker shows the predicted Asynchrony SD for the IT position if the same timing strategies were applied as in positions LD-F2. Filled-diamonds show the actual data points – note the IT data marker is much higher than predicted. Error bars show SEM.

