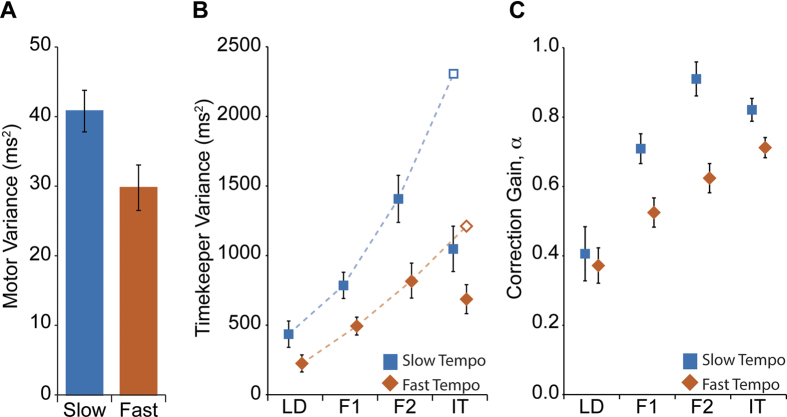
Figure 4. Parameters from a linear phase correction model were estimated from each participant’s asynchrony and IMI time series data.
(A) Motor Variance. Estimates of motor variance remained relatively constant across positions. However, movements in the slow tempo conditions showed higher motor variance compared to estimates from the fast tempo conditions. Error bars indicate SEM. (B) Timekeeper Variance. As with motor variance, timekeeper variance was higher at slow movement tempos (blue square markers) than for fast movement tempos (orange diamonds). Estimates of timekeeper variance also showed increasing values further along the chain, indicating sensitivity to higher cue variance generated by the adjacent position. Moreover, as observed for IMI variability, we saw no significant increase in timekeeper variance in position IT, with actual estimates (filled symbols) being much lower than the predicted value (open symbol marker). Dashed lines show polynomial fits (order 2) based on the points LD, F1 and F2 only. Error bars are SEM. (C) Correction Gain. Estimates of correction gain indicate that participants actually increased their corrections as they moved further down the chain. Additionally, correction gains were larger in the slow tempo (blue squares) than the fast tempo (orange diamonds) conditions. Once again, we observed evidence in a change of strategy in the IT position compared to the other positions in the chain. Error bars are SEM.

