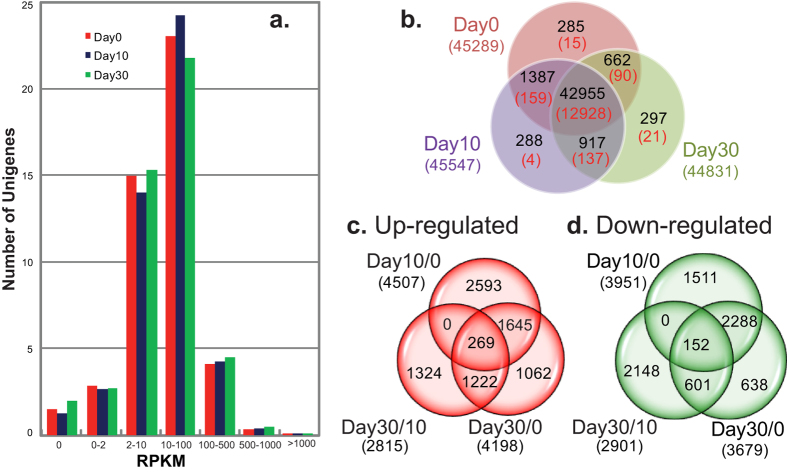
Figure 3. Expression profiling of C. yanhusuo Unigenes during the bulb development.
(a) Number of Unigenes expressed at defined expression levels Numbers on the Y-axis were in units of 1,000. (b) Numbers under the stage name are total numbers of DGEs detected by uniquely-mapped reads at the corresponding stage; Numbers in black on Ven diagram meant number of shared and unique genes among the three developmental stages; Numbers in red on the Ven diagram are numbers of shared and unique DEGs among the three developmental stages. a total of 13,354 DEGs were identified in at least one pairwise comparison of developmental stages. (c,d) Numbers in () showed are total numbers of DEGs up- or down-regulated between two compared stages. Numbers on Ven diagram are numbers of DEGs shared or unique among different comparisons.

