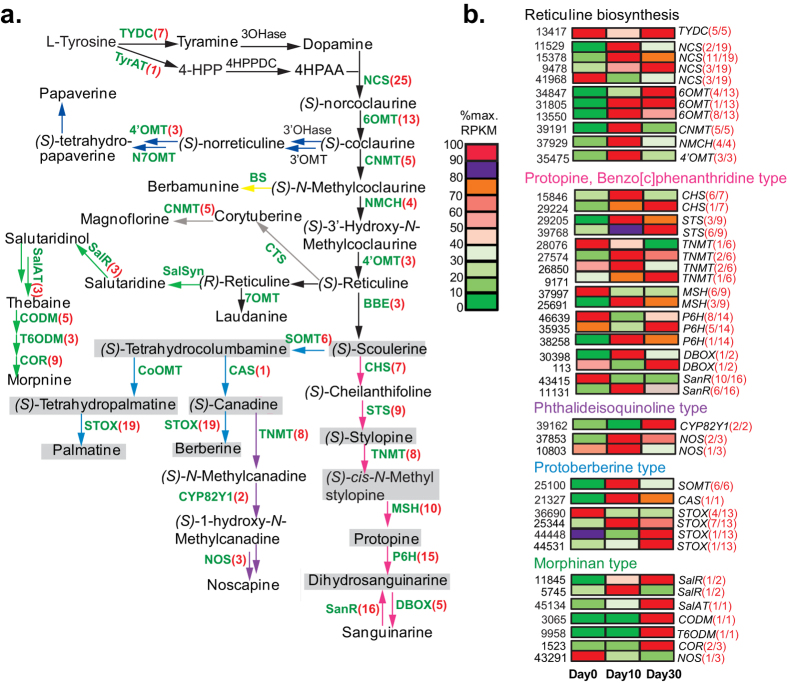
Figure 4. Expression patterns of BIAs biosynthetic unigenes during C. yanhusuo bulb development.
(a) Biosynthetic pathways leading to major benzylisoquinoline alkaloids (BIAs) are based on Beaudoin and Facchini26. Pathways: black arrows 1-benzylisoquinoline; dark blue arrows, papaverine; green arrows, morphinan; purple arrows, phthalideisoquinoline; light blue arrows, protoberberine; yellow arrows, bisbenzylisoquinoline; grey arows, aporphine; pink arrows, benzo[c]phenanthridine; Enzymes for which corresponding genes have been isolated from other plants were shown in green. Enzymes for which corresponding genes have not been isolated from any plant are shown in black. The number of identified C. yanhusuo unigenes is shown in () following the abbreviated nameof the corresponding enzyme whose full name can be found in Table S1. Intermediates or alkaloid compounds that have been identified in C. yanhusuo are shaded in gray. Although coptisine, tetrahydrojatrorrhizine, jatrorrhizine, allocryptopine, N-methyltetrahydrocolumbamine, N-methyltetrahydrocoptisine and columbamine are also present in C. yanhusuo bulbs, their final biosynthetic steps mainly involved STOX28 and are not displayed here since STOX catalyzes the formation of many such metabolites. Two unigenes identified as Pavine N-methyltransferase are not listed here. Abbreviations unlisted in Table S1: 4HPP, 4- Hydroxyphenylpyruvate; 4HPAA, 4- Hydroxy- phenylacetaldehyde; 3OHase tyrosine/tyramine 3-hydroxylase; 4HPPDC 4-hydroxyphenylpuruvate decarboxylase; 3′OHase uncharacterized 3′-hydroxylase; 3′OMT uncharacterized 3′-O-methyltransferase. (b) Expression patterns of representative DEGs. Only one of the differentially expressed BIA unigenes with similar expression patterns is shown here to represent different expression patterns of the gene family. The grids with 10 different colors from dark green to red show the relative expression levels to maximum RPKM values: 0–10, 10–20, 20–30, 30–40, 40–50, 50–60, 60–70, 70–80, 80–90 and 90–100%, respectively. The detailed value for each gene is given in Table S7. Unigene IDs are shown on the left. On the right of the grids, the numbers of differentially expressed BIA unigenes and DEGs with similar expression patterns are shown in (), following the abbreviated names of the corresponding enzymes. Expression of the enzymes functioning in multiple branch pathways is displayed just once.

