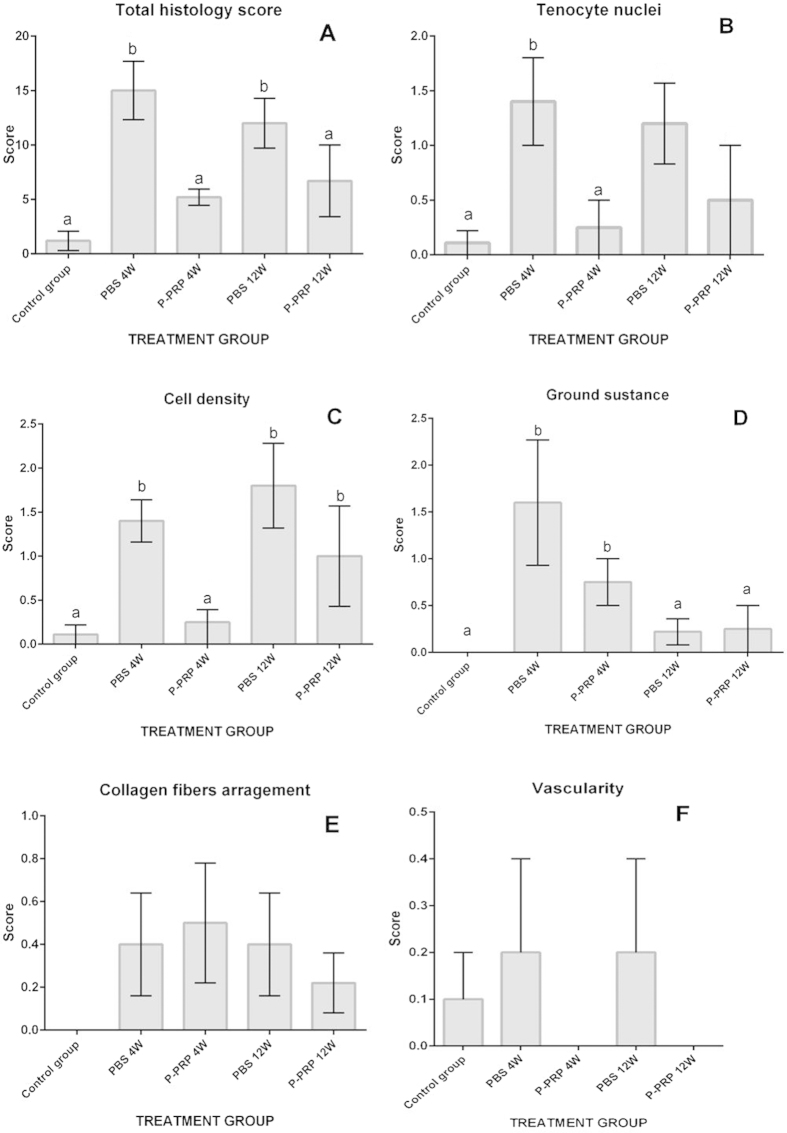
Figure 3. Means (± s.e.m) of the histology scores of tendon repair.
(A) Total histology score. (B) Tenocyte nuclei score. (C) Cell density score. (D) Ground substance score. (E) Collagen fibers arrangement score. (F) Vascularity score. (a–b) Lower-case letters denote significant differences by the U-Mann-Whitney test for the evaluated groups over time (*p < 0.05).

