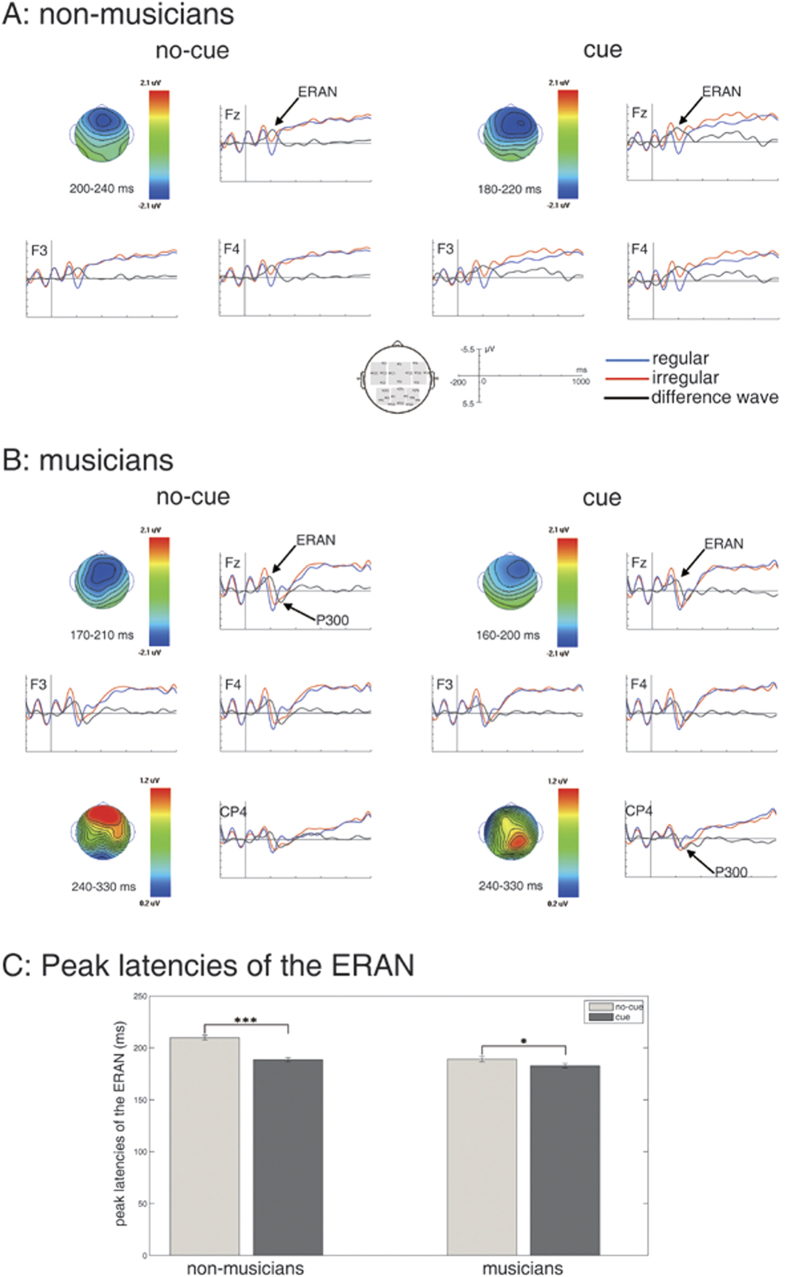
Figure 1. The upper panel (A) shows grand-average of ERPs elicited by regular (blue) and irregular (red) chords in the conditions in which participants were not cued (non-cued condition) or cued (cued condition) as to whether the final chord was regular or irregular for non-musicians (n = 20).
The black waveform shows difference potentials (regular subtracted from irregular chords). Compared to regular chords, irregular chords elicited an early right anterior negativity (ERAN, indicated by arrows). Isopotential maps of the ERAN (difference potentials, regular subtracted from irregular chords) in the non-cued and the cued conditions are shown. The inset shows the ROIs used for statistical analyses (shaded in gray). The middle panel (B) shows ERPs elicited by regular (blue) and irregular (red) chords in the non-cued and the cued conditions in musicians (n = 20). Compared to regular chords, irregular chords elicited an ERAN and a P300 (indicated by arrows). The P300 had a more frontal preponderance in the non-cued condition, and a more posterior preponderance in the cued condition. Isopotential maps of the ERAN and the P300 (difference potentials, regular subtracted from irregular chords) in the non-cued and the cued conditions are shown. The bottom panel (C) shows peak latencies of the ERAN (difference potentials, regular subtracted from irregular chords) in the non-cued and the cued conditions in non-musicians and musicians. The data show that the latency differences between the non-cued and the cued conditions were statistically significant for both non-musicians and musicians. Error bars indicate standard error of mean (SEM). *p < 0.05, **p < 0.01, ***p < 0.001.

