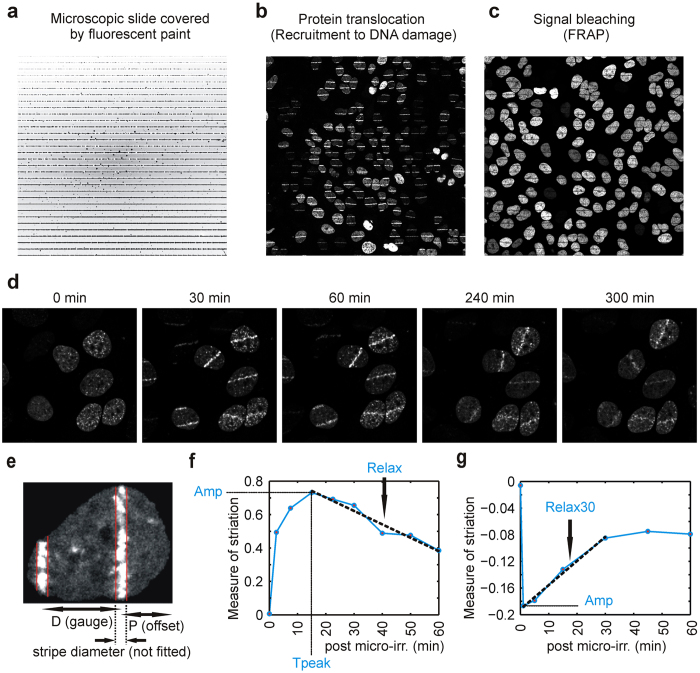
Figure 1. Method introduction.
(a) Visualization of the striation pattern on a layer of fluorescent paint. (b) Striation pattern induced by a 355 nm laser (32 lines/field) in BrdU pre-sensitized U-2-OS-MDC1-GFP cells. DNA damage is visualized by recruitment of ectopically expressed MDC1-GFP protein. (c) Striation pattern bleached by a 488 nm laser (32 lines/field) in U-2-OS cells ectopically expressing histone H2B-GFP. (d) Evolution of the striation pattern over time. Cell line and DNA damage induction were the same as in (b). (e) Automatic stripe recognition by the software in the nucleus based on known values (gauge and position of the stripe) and additional fitting of recognized stripes. (f) Typical evolution of striation pattern after DNA damage caused by a 355 nm laser irradiation (32 lines/field, 1 iteration) in BrdU pre-sensitized U-2-OS-MDC1-GFP cells. The curve is plotted as medians of measure of striation (MS) values at indicated time points. The following parameters are used to describe the curve: Amp (amplitude, the maximum of MS over all time points), Tpeak (time to reach maximum MS), Relax (slope of the line fitted to MS values after Tpeak). (g) Typical evolution of striation pattern after bleaching. FRAP curve is formed by median values of MS at each time-point. The following parameters are used to describe the curve: Amp (amplitude, the minimum of MS), Relax30 (slope of the line fitted to MS values between 1 min and 30 min). Used cell line is the same as in (c).

