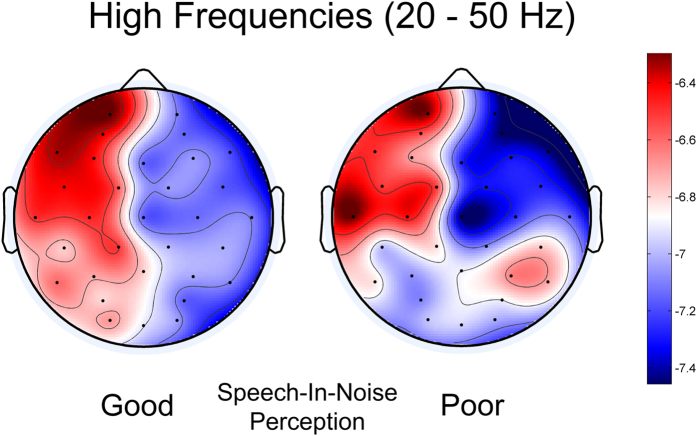
Figure 3. High-frequency cortical oscillatory activity was more left lateralized for children who were better perceivers of speech in noise.
Topographic plots show the distribution of high-frequency (20–50 Hz) oscillations in good (left) and poor (right) perceivers of speech in noise. Red indicates more spectral power, and a leftwards bias for high-frequency oscillations is evident, particularly in the good speech-in-noise perception group.

