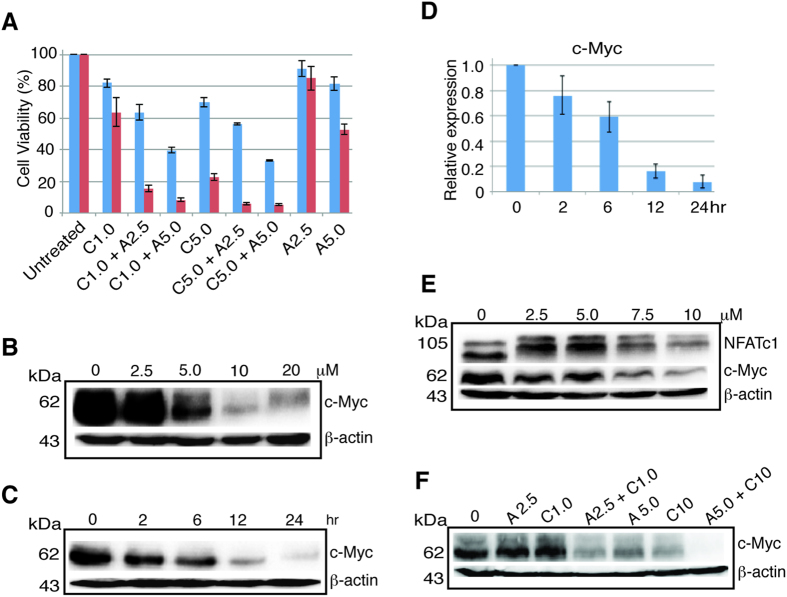
Figure 1. AS and CsA exert synergistic cell killing and c-Myc downregulation.
(A) HCT116 cells were treated with CsA (C) or AS (A) alone or in combination in different concentrations as indicated in μM, for 24 (blue) or 48 (red) hours. Statistically significant difference was seen in all comparisons between cells treated with CsA or AS alone and cells treated with CsA plus AS in same concentration. Data represents one of the three identical experiments with similar results. Very significant statistical difference was detected for all four combinations versus the corresponding single agent treatment (see Table S1). (B) HCT116 cells were treated with AS in different concentration as indicated for 24 hours and blotted with antibody against c-Myc and β-actin. (C) HCT116 cells were treated with 10 μM AS for different time course (hour) as indicated and blotted with antibody against c-Myc and β-actin. (D) RT-PCR of c-Myc after HCT116 cells were treated with 10 μM AS from 2 to 24 hours. Error bar represents the standard deviation (SD) of the results of three separate experiments. (E) HCT116 cells were treated with CsA in different concentration as indicated for 24 hours and blotted with the antibody against NFATc1, c-Myc and β-actin. (F) HCT116 cells treated with AS or CsA alone or in combination for 24 hours, lysates were probed with antibody against c-Myc and β-actin. kDa, molecular weight.

