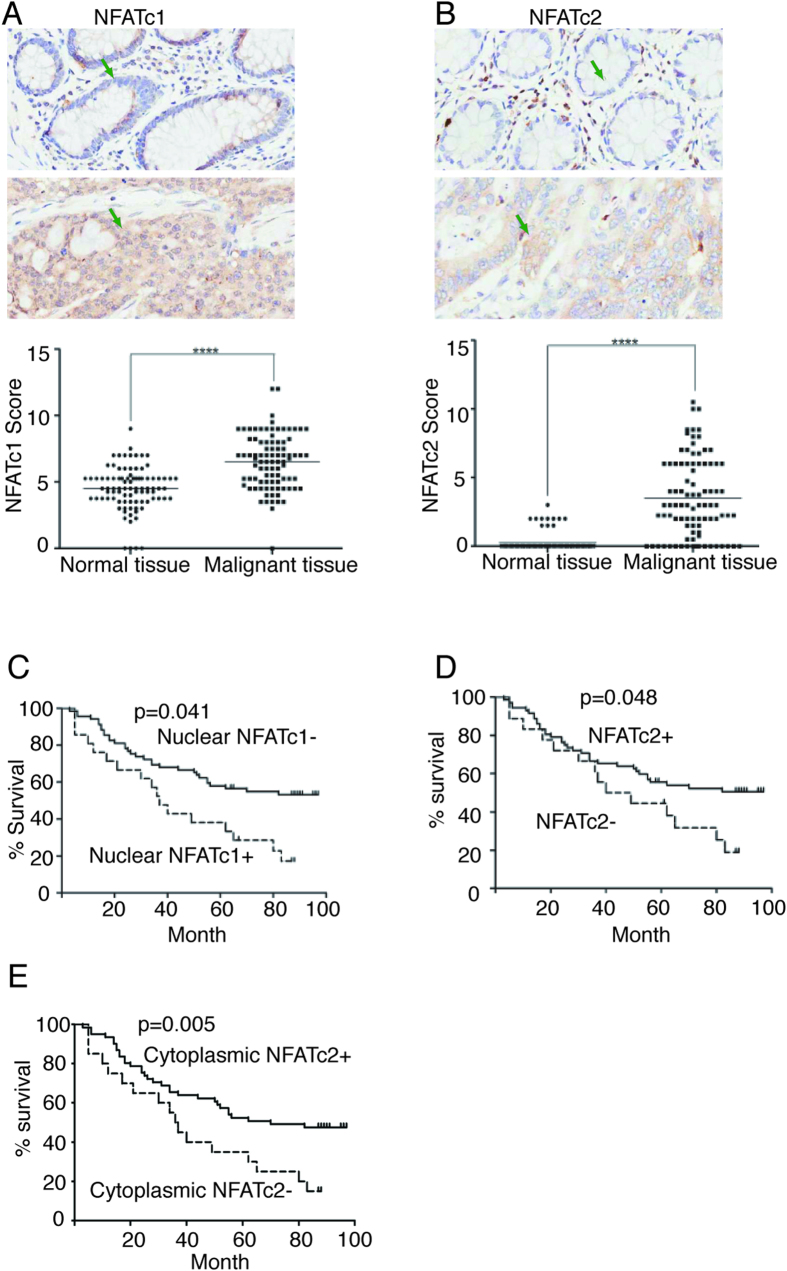
Figure 7. Tumor expression of NFATc2 and nuclear NFATc1 correlated with survival.
(A) Expression of NFATc1 in adjacent normal colon endothelium (upper panel) and in colon cancer (middle panel), and comparative analysis of NFATc1 expression between the adjacent normal endothelium and colon cancer of the 90 cases (****p < 0.0001, lower panel). Green arrows point to representative cells with negative or positive expression. (B) Expression of NFATc2 in the adjacent normal colon endothelium (upper panel) and in colon cancer (middle panel), and comparative analysis of NFATc2 expression between the adjacent normal endothelium and colon cancer of the 90 cases. (****p < 0.0001, lower panel). Green arrows point to representative cells with negative or positive expression. (C) Kaplan-Meier analysis of overall survival by the function of NFATc1 nuclear expression. Statistically significant difference (p = 0.041) between the patients with negative and positive nuclear NFATc1 expression (NFATc1− or NFATc1+) is indicated. (D) Kaplan-Meier analysis of overall survival by the function of NFATc2 expression (positive expression in either cytoplasm or nucleus or both) in the 90 patients with colon cancer. Statistically significant difference (p = 0.048) between the patients with positive or negative NFATc2 expression (NFATc2+ or NFATc2-) is indicated. (E) Kaplan-Meier analysis of overall survival by the function of NFATc2 cytoplasmic expression. Statistically significant difference (p = 0.005) between the patients with positive and negative NFATc2 cytoplasmic expression (cytoplasmic NFATc2+ or cytoplasmic NFATc2−) is indicated.

