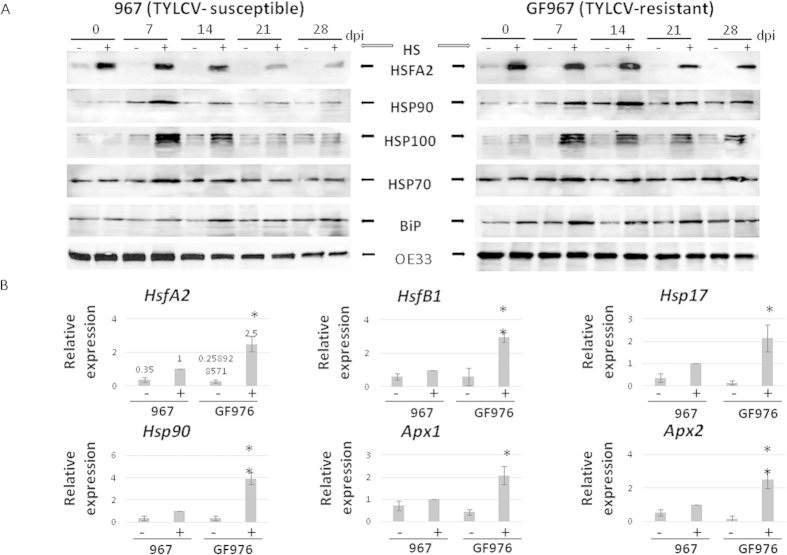
Figure 3. Differences in protein amounts and expression of HS-inducible genes in TYLCV-susceptible (967) and resistant (GF967) tomatoes grown at normal and high temperatures.
(A) Western blot analyses of plant transcription factor HSFA2 and HSPs in tomatoes grown at normal temperature (−, regime 1) and at high temperatures (+, regime 2). The OE33 chloroplast protein was used as protein loading control. (B) qRT-PCR analyses of Hsf, Hsp and Apx gene transcripts of the two lines grown for 21 days at normal temperature (−, regime 1) and at high temperatures (+, regime 2) at 14 dpi. The expression level of each gene was calculated in relation to leaves of susceptible line grown at high temperature. The results were normalized using the β-actin gene as an internal marker. Results were analyzed using student’s t test. One asterisk denotes p < 0.05. Two asterisks denotes p < 0.01. Bars represent the average and standard deviation of the relative expression from five independent biological repeats; pooled leaves of three different plants were taken for each sample.

