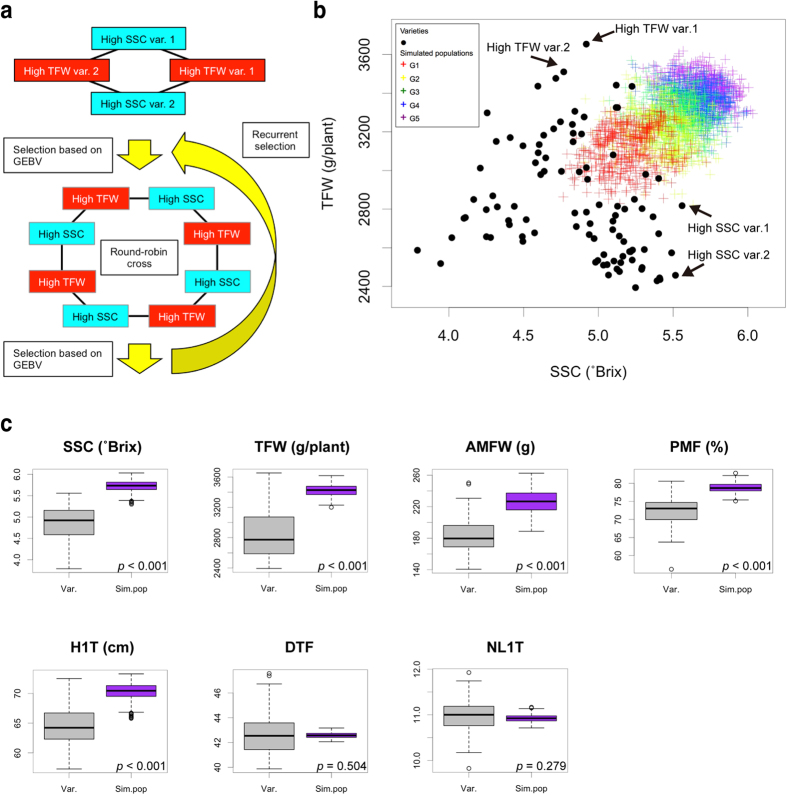
Figure 3. Results of simulations for the recurrent genomic selection.
(a) Scheme of breeding strategy used in the present study. (b) Distributions of the genomic estimated breeding values (GEBVs) of total fruit weight (TFW) and soluble solids content (SSC). Black circles and coloured crosses indicate the GEBVs of the 96 varieties and the simulated populations, respectively. G1 to G5 indicate the generation of breeding population during the cycles of recurrent genomic selection. (c) Boxplots for the GEBVs in the fifth generation of the simulated population (G5 in Fig. 3b). Statistical analysis was performed using Welch’s t-test. ‘Var.’ and ‘Sim.pop.’ at the bottom of each panel indicate the 96 varieties and the simulated population, respectively. AMFW, average marketable fruit weight; PMF, percentage of marketable fruits; H1T, height to the first truss; DTF, days to flowering; NL1T, number of leaves under the first truss. See Table 1 for details. GEBVs of each trait were estimated by using the statistical method that showed the highest predictability in leave-one-out cross-validation in Table 3.

