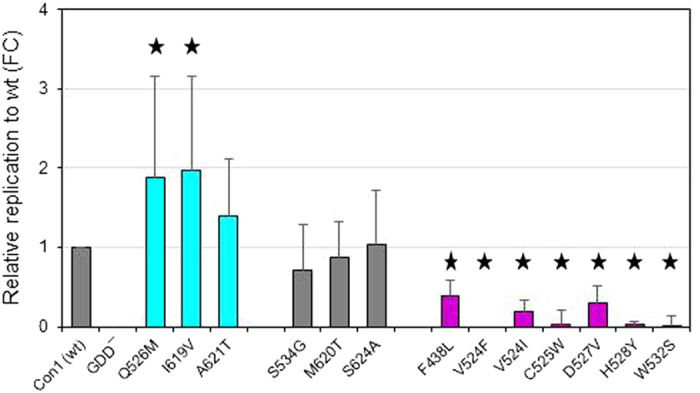
Figure 1. Impact of helicase mutations on HCV RNA replication.

HCV RNA determined by two-step reverse transcription quantitative real-time PCR (RT-PCR), normalized to that of the wild type Con1 RNA from each helicase mutant. Bars are color coded as follows: cyan – increased replicative fitness; grey – not different from wild type; magenta – decreased replicative fitness. The data shown represent the mean ± SD from at least ten independent experiments. “wt” refers to wild type. Y axis shows relative replication to wt as fold change (FC). An asterisk designates mutants for which the fold change compared to wt is significant by Student t-test (P < 0.05).
