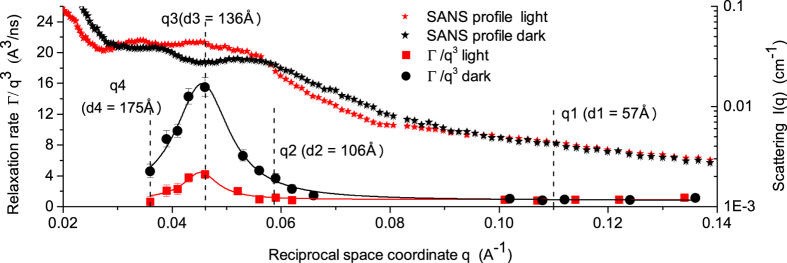
Figure 2. q3 dependence of the decay rate Γ for cyanobacteria during light and dark states.
The vertical dashed lines show the position of the corresponding observed distances within membrane pairs, with q3 at the peak of Γ function. With increasing distance observed (from q1 to q2), the influence of the neighboring membrane becomes apparent in the increase of the relaxation rate up to a maximum where the membranes repel each other. This leads to a decrease of the relaxation rate to the state where the influence of the neighboring membrane is no longer visible (q4). Small Angle Neutron Scattering profiles8 are super-imposed to observe the correlation of dynamics features with the structure.

