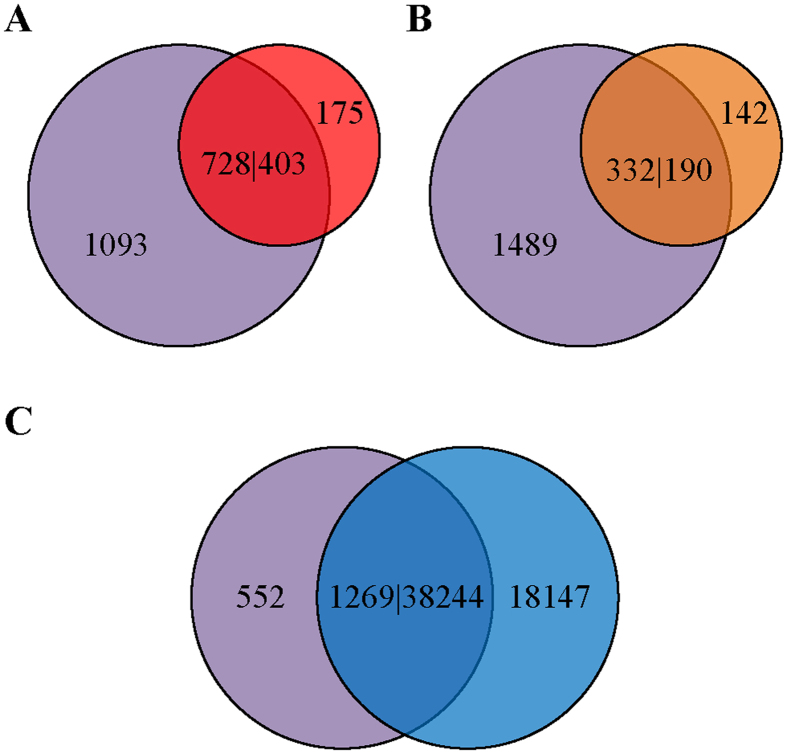
Figure 4. Comparison of MITEs detected in rice genome using detectMITE versus MITE-Hunter, MITE Digger and RSPB respectively.
(A) Comparison between detectMITE and MITE-Hunter. (B) Comparison between detectMITE and MITE Digger. (C) Comparison between detectMITE and RSPB. The violet, red, brown, blue circles represent the outputs of detectMITE, MITE-Hunter, MITE Digger and RSPB respectively. The overlapping parts represent numbers of MITE sequences that match each other by blastn (E-value ≤10−10). Using (A) as an example, 728|403 means 728 MITE super-families in detectMITE output match 403 sequences in MITE-Hunter output, 1093 represents the number of MITE super-families in detectMITE output that do not match any sequences in MITE-Hunter output, and 175 represents the number of MITE sequences in MITE-Hunter output that do not match any super-families in detectMITE output.

