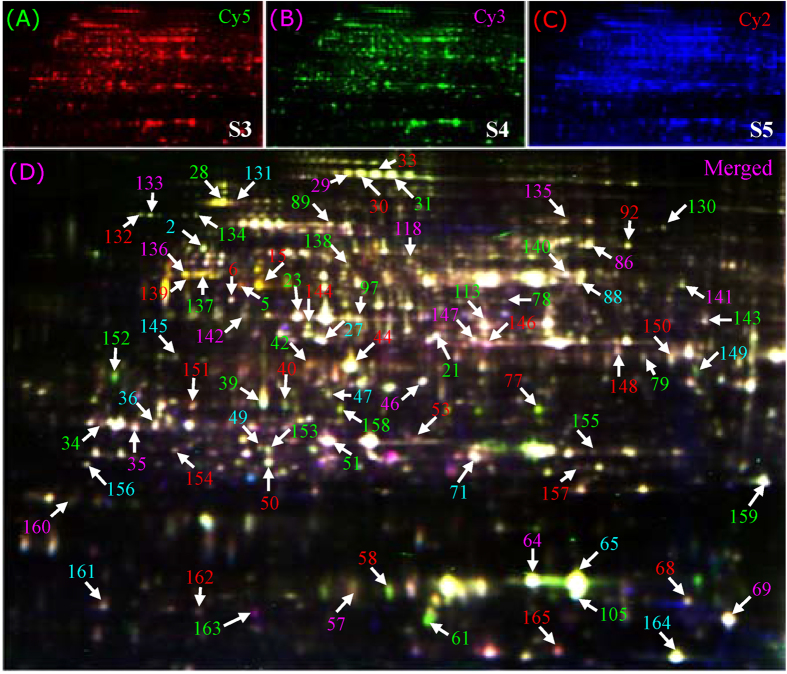
Figure 3. Typical 2-D DIGE images of the cassava root proteins at different developmental stages.
Equal amounts (50 μg) of proteins obtained from cassava roots at S3, S4 and S5 (75, 100 and 130 DAP, respectively) were labeled with the Cy2, Cy3 and Cy5 fluorescence dyes, respectively. The three labeled and quenched samples were combined, and a total 150 μg of proteins were mixed and added to the rehydration buffer to perform 2-DE. The labeled proteins were visualized using parameters appropriate for the individual cyanine dyes. Red, Cy5 for S5 (A); Green, Cy3 for S4 (B); Blue, Cy2 for S3 (C). The combination image (D) of the three stages is highlighted. Most of the numbered protein spots correspond to the samples on the CBB-stained 2-DE gels. All of these protein spots were subjected to MS, and their identities are listed in detail in Table S2 and Fig. S3.

