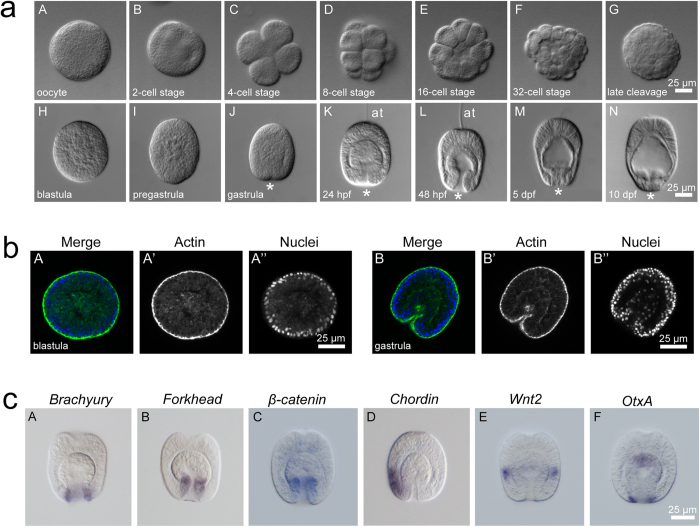
Figure 1. Development of Aiptasia.
(a) Overview of Aiptasia embryonic and larval development using differential interference contrast (DIC) microscopy. *indicates the blastopore; hpf = hours post fertilization; dpf = days post fertilization. (b) Representative confocal microscopy images of Aiptasia blastula (A–A”) and gastrula (B–B”). The left panels (A and B) show merged images of Hoechst-stained nuclei (blue) and phalloidin-stained F-actin (green), the middle panels (A’ and B’) only actin, and the right panels (A” and B”) only nuclei. (c) Gene expression patterns of key classical developmental regulators in Aiptasia larvae ∼24 hpf using in situ hybridization.

