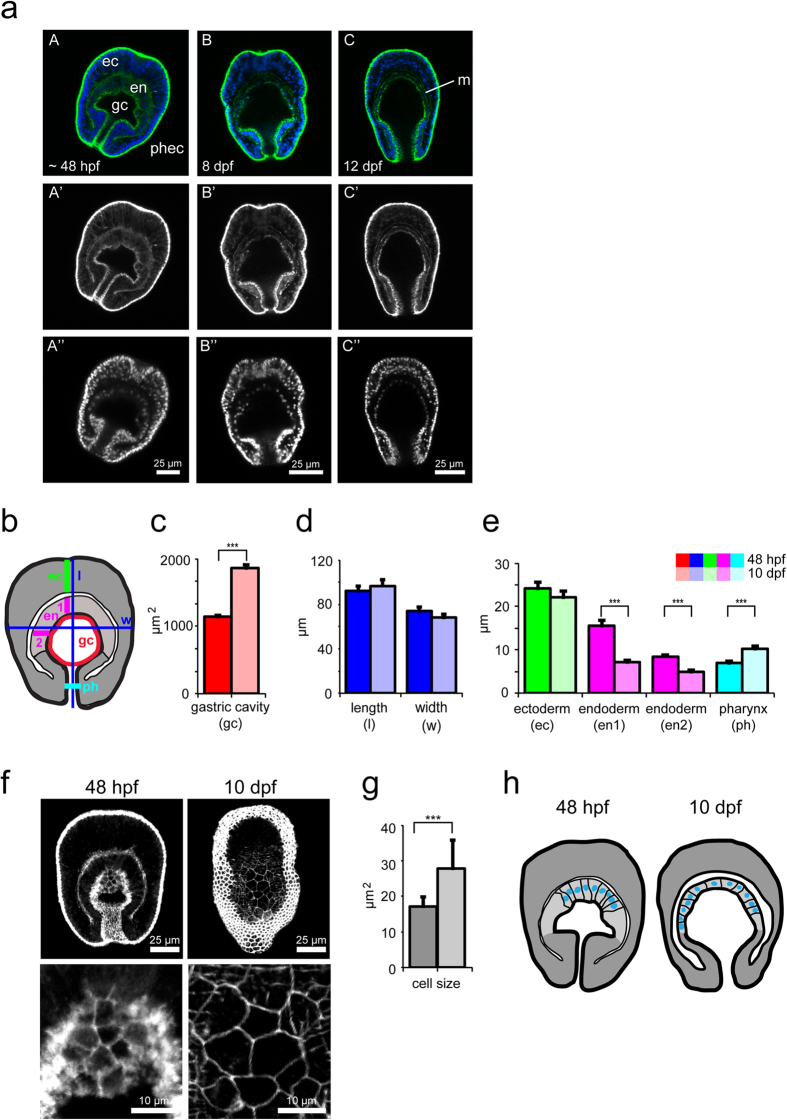
Figure 2. Morphological changes of the larval endoderm during development.
(a) Representative confocal microscopy images of Aiptasia larvae 48 hpf (A–A”), 8 dpf (B–B”), and 12 dpf (C–C”). The upper row (A–C) shows merged images of Hoechst-stained nuclei (blue) and phalloidin-stained F-actin (green), the middle row (A’–C’) only actin, and the lower row (A”–C”) only nuclei. The endoderm (en), ectoderm (ec), gastric cavity (gc), pharyngeal ectoderm (phec), and mesoglea (m) are indicated. (b) Schematic of larva with colored lines indicating positions of measurement of morphological features in (c–e). n = 23 for larvae 48 hpf and n = 22 for larvae 10 dpf. (c) Quantification of change in gastric cavity area between larvae 48 hpf and 10 dpf. Error bars are SEM, ***p < 0.001 as determined by Student’s t-test for unpaired data. (d) Quantification of change in larval length and width between larvae 48 hpf and 10 dpf. Error bars are SEM. (e) Quantification of change in thickness of the ectoderm (ec), endoderm (en1, en2), and pharyngeal width (ph) between larvae 48 hpf and 10 dpf. Error bars are SEM, ***p < 0.001 as determined by Student’s t-test for unpaired data. (f) Representative confocal microscopy images of Aiptasia larvae 48 hpf and 10 dpf showing phalloidin-stained F-actin to mark the cell outlines. Each image comprises z-projections of multiple planes of the endoderm. Below are corresponding higher-magnification images of endodermal cells. (g) Quantification of endodermal cell sizes of larvae 48 hpf and 10 dpf from images as shown in (f). Error bars are SEM, ***p < 0.001 as determined by Student’s t-test for unpaired data, n = 56 cells for larvae 48 hpf (5 larvae) and n = 82 cells for larvae 10 dpf (5 larvae). (h) Schematic of larvae summarizing morphological changes: younger larvae (48 hpf) have a small gastric cavity, a thick endoderm with columnar cells, and a pronounced pharyngeal ectoderm when compared to older larvae (10 dpf), which have a bigger gastric cavity, flattened endodermal cells, smaller pharyngeal ectoderm, and more pronounced mesoglea.

