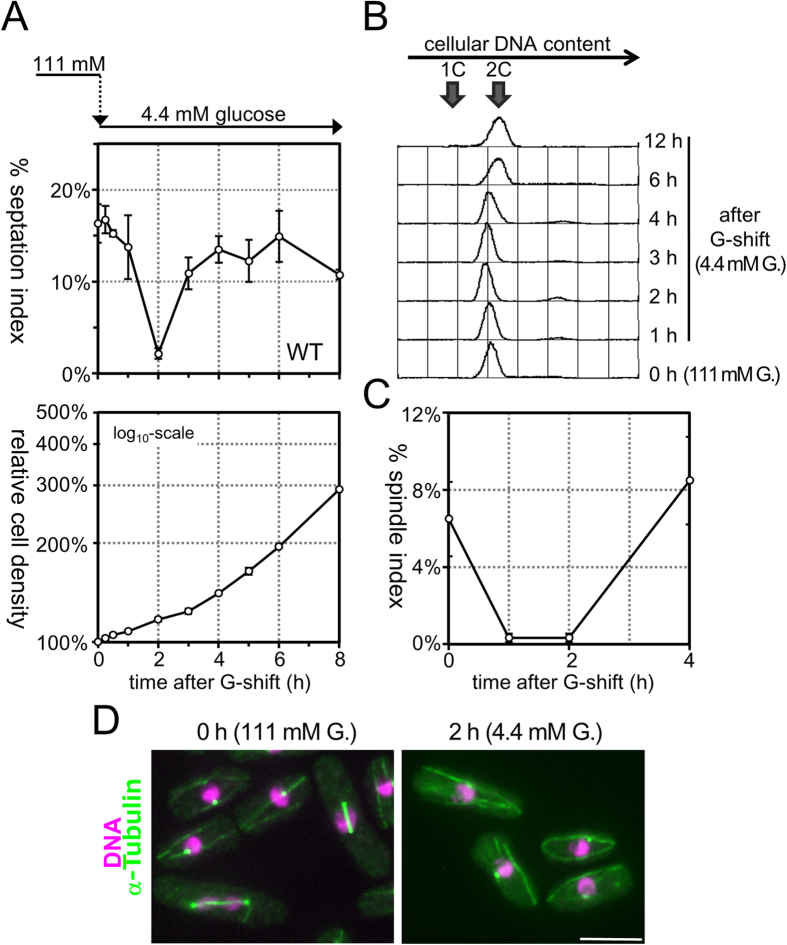
Figure 1. Glucose restriction causes transient cell cycle arrest in G2 phase.
(A) Time courses of septation index (upper panel) and relative cell density (lower panel) of WT fission yeast cells that were transferred from high-glucose (111 mM) to low-glucose (4.4 mM) medium at time = 0 were examined. The averages of three independent experiments are shown, and the bars represent standard deviation (SD). (B) The distributions of cellular DNA content were measured in WT cells by flow cytometry analysis after transfer from high-glucose to low-glucose medium at time = 0. The positions of the peak of 1C (before replication) and 2C (after replication) DNA cells are indicated by arrows. (C) The time course of changes in the proportion of cells with a mitotic spindle (spindle index) was examined in WT cells after transfer to low-glucose medium. The experiments were repeated independently three times, and the averages and SD are shown. (D) Fluorescence microscopic images of WT cells expressing GFP-fused α-tubulin and Sid4 before (left panel) and 2 hours after transfer to low-glucose medium (right panel) are shown. GFP fluorescence is pseudocoloured green, whereas the nuclear DNA stained by DAPI is shown in magenta. Bars, 5 μm.

