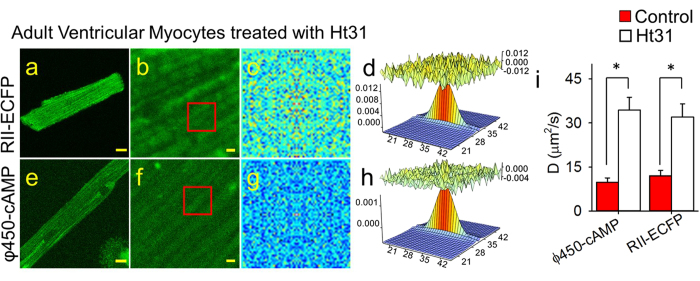
Figure 5. RICS analysis of φ450-cAMP and RII-ECFP in adult ventricular cardiac myocytes treated with St-Ht31 peptide.
Representative confocal images of St-Ht31-treated myocytes expressing RII-ECFP (a,b) or loaded with φ450-cAMP (e,f) at low (a,e, scale bar 10 μm) and high (b,f, scale bar 1 μm) magnification. (c,g) Average of the spatial correlation calculated for a region of 64 × 64 pixels (indicated by the red box in b,f) for each of 100 images of RII-ECFP (c) and φ450-cAMP (g) in St-Ht31-treated myocytes. Fit of the correlation functions for RII-ECFP (d) and φ450-cAMP (h). The plot at the top of those panels represents the difference between the autocorrelation and the fit. (i) Bar plots (average ± s.e.m.) of the diffusion coefficient (D) values obtained for RII-ECFP and φ450-cAMP in control (red bars) or St-Ht31-treated (open bars) myocytes (*p < 0.05. RII-ECFP expressing cells: n = 8–11, φ450-cAMP loaded cells: n = 15–37).

