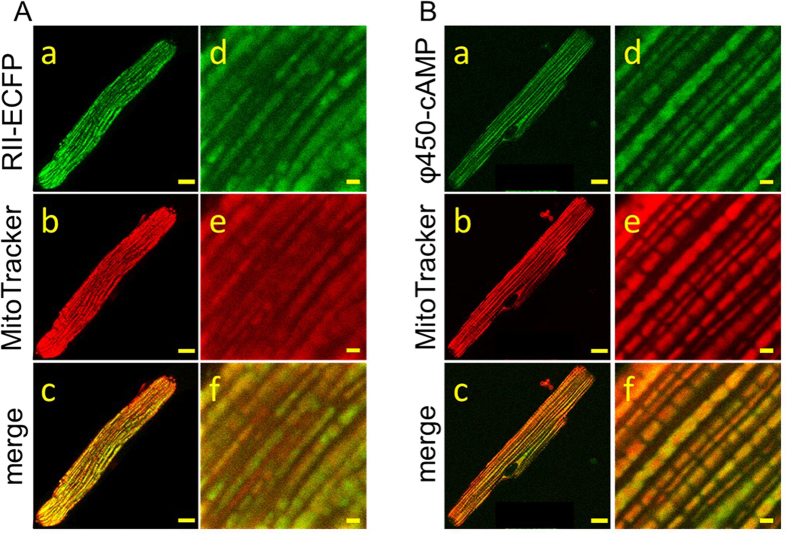
Figure 6. Co-localization of the type II regulatory subunit (RII) of PKA or φ450-cAMP with MitoTracker red in cardiac myocytes.
Representative confocal images of myocytes expressing RII-ECFP (A) or loaded with φ450-cAMP (B) at low (a–c, scale bar 10 μm) and high (d–f, scale bar 1 μm) magnification. Mitochondria labeled with MitoTracker red show a longitudinal striated pattern (b,e). The merged images demonstrate a high degree of co-localization of RII-ECFP (Ac, Af) or φ450-cAMP (Bc, Bf) with MitoTracker red. PCC 0.28 ± 0.017, tM1 0.49 ± 0.018, tM2 0.60 ± 0.017, n = 7 (panel A). PCC 0.22 ± 0.0049, tM1 0.39 ± 0.0064, tM2 0.65 ± 0.0066, n = 13 (panel B).

