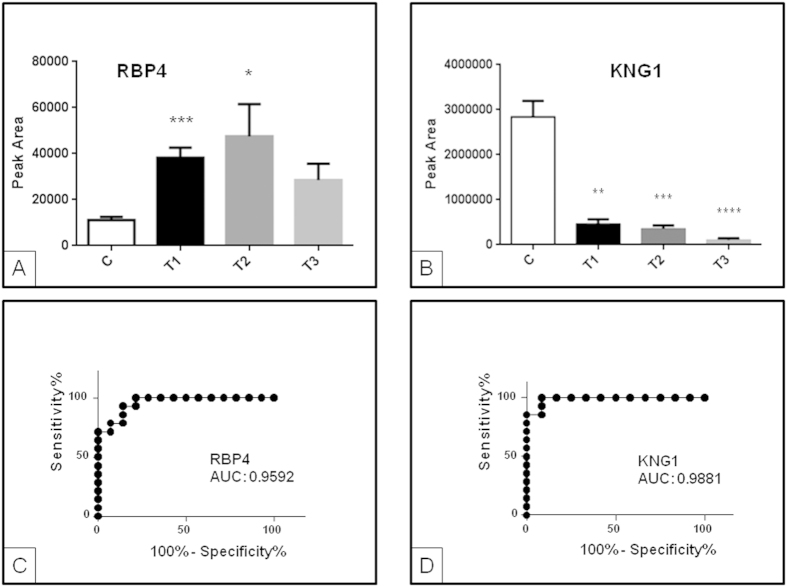
Figure 2.
Urinary RBP4 (A) and KNG1 (B) analysis by (SRM)LC-MS/MS. Transitions shown (precursor→fragment) are: 813.48->970.60 (RBP4) and 713.70->956.0 (KNG1). A different cohort of individuals to that used in DIGE analysis was recruited. Increased urinary levels for RBP4 in response to AKI were confirmed. Error bars show standard error of media. ROC curves showing response to AKI were calculated for RBP4 (C) and KNG1 (D). *p value ≤ 0.05; **p value ≤ 0.01; ***p value ≤ 0.001; ****p value ≤ 0.0001.

