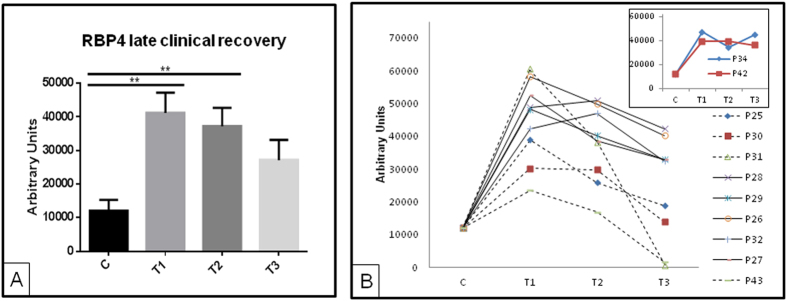
Figure 4. WB data for RBP4 and KNG1 for patients who clinically recovered later than T3 according to sCr.
Normalization of RPB4 levels was observed already at T3 on average (A,B) Individual RBP4 responses for those patients monitored at the three time points (solid lines represent patients with sCr(T3) > 1.3 mg/dL and dashed lines represent patients with sCr(T3) ≤ 1.3 mg/dL). Inset shows representative behavior of RBP4 for patients who do not recover. **p value ≤ 0.01.

