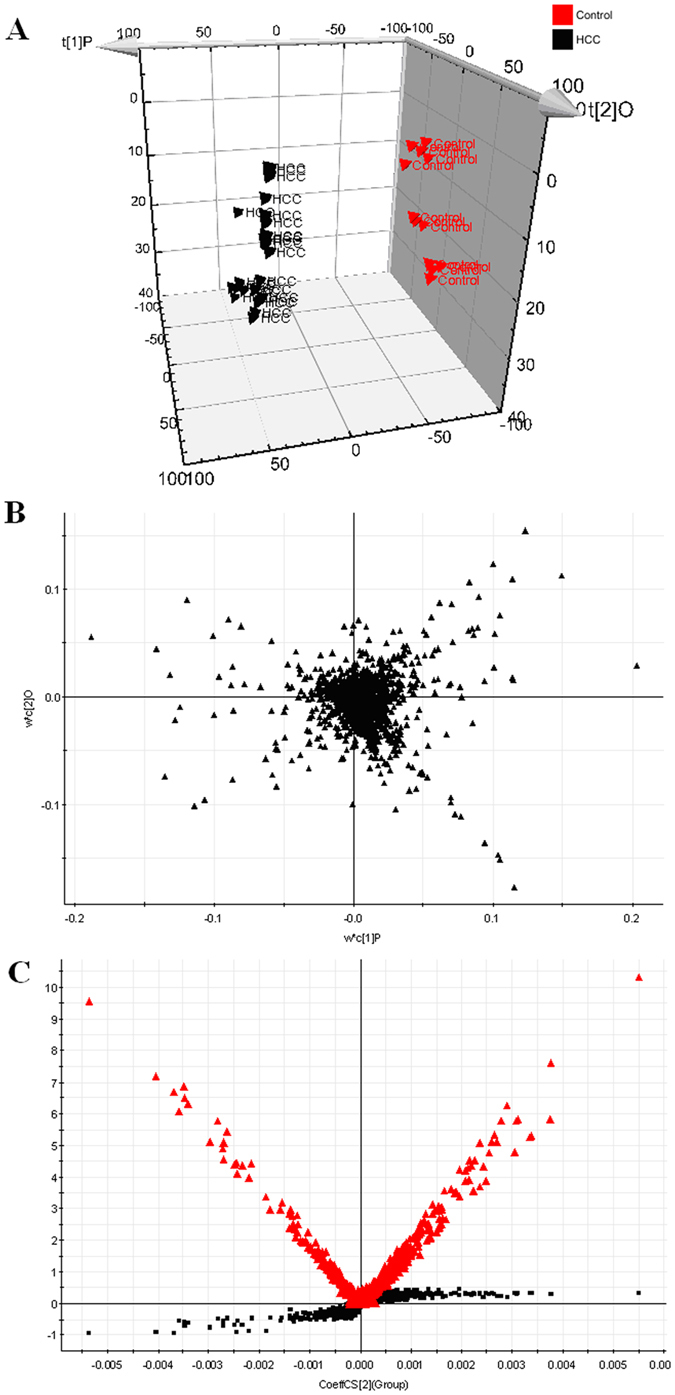
Figure 1. Metabolomic profiling of HCC in positive mode.

3-D of PCA model that is an unsupervised method of extracting information for HCC group (A). Loading plot of OPLS-DA of HCC in positive mode (B). Panel (C) shows the combination of S- and VIP-score plots constructed from the supervised OPLS analysis of urine (ESI+ mode). Ions with the highest abundance and correlation in the HCC group with respect to the controls are present on the upper far right hand quadrant, whereas ions with the lowest abundance and correlation in the HCC group with respect to the control group are residing in the lower far left hand quadrant.
