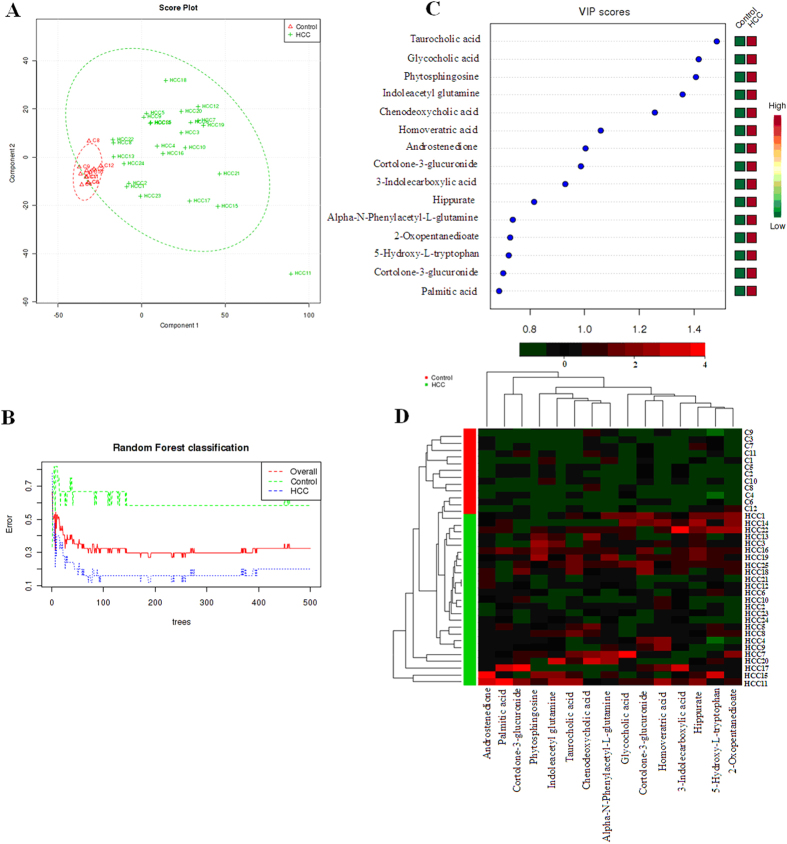
Figure 2. Systems analysis of metabolomic alterations of the control and HCC samples utilizing MetaboAnalyst’s data annotation tools revealed differences between the two groups.
(A) Trajectory analysis of PCA Score plots for the HCC. (B) Random Forests machine learning algorithm classification for the HCC, implemented in MetaboAnalyst and used for unsupervised clustering. (C) Top 15 significant features of the metabolite markers based the VIP projection, which were extracted with random Forests analysis. (D) Heat map visualization and hierarchical clustering analysis for the urine of HCC. The heatmaps were constructed based on the top fifty metabolites of importance, which were extracted with random Forests analysis. Variable differences are revealed between the control and HCC groups, with verified and known ions marked on the bottom corresponding to SI Table 2. Rows: samples; Columns: metabolites; Color key indicates metabolite expression value, green: Lowest, red: highest.

