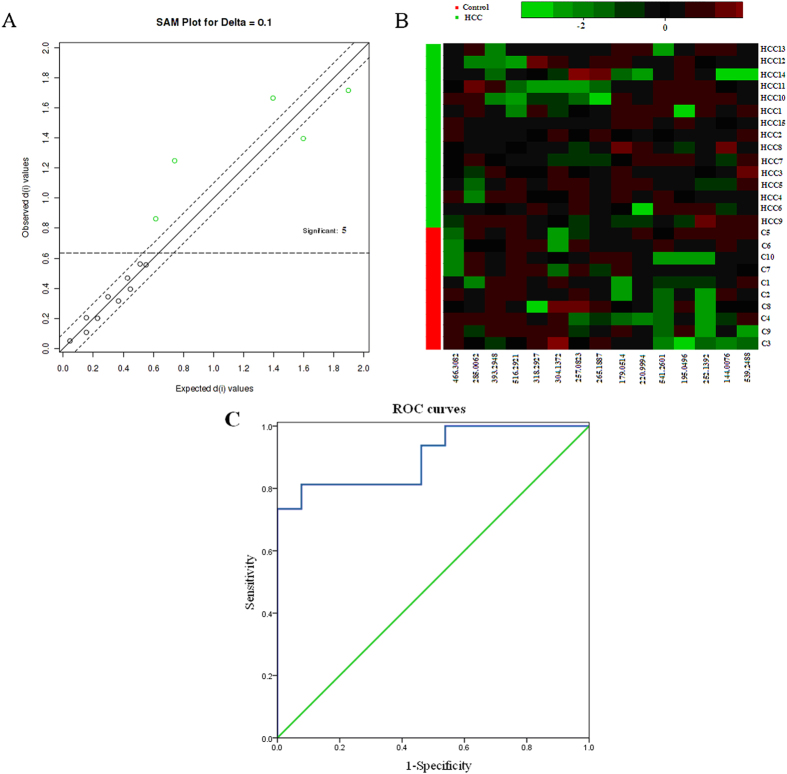
Figure 4. The selection and diagnostic potential of the most significant metabolites.
(A) The significance analysis for microarrays method used to select marker metabolites. (B) The unsupervised clustering dendrogram of potential marker metabolites, tested our approach using a second set of HCC (n = 15) patients and control subjects (n = 10) to be blindly selected. (C) ROC curves for the diagnosis of HCC patients using metabolic markers.

