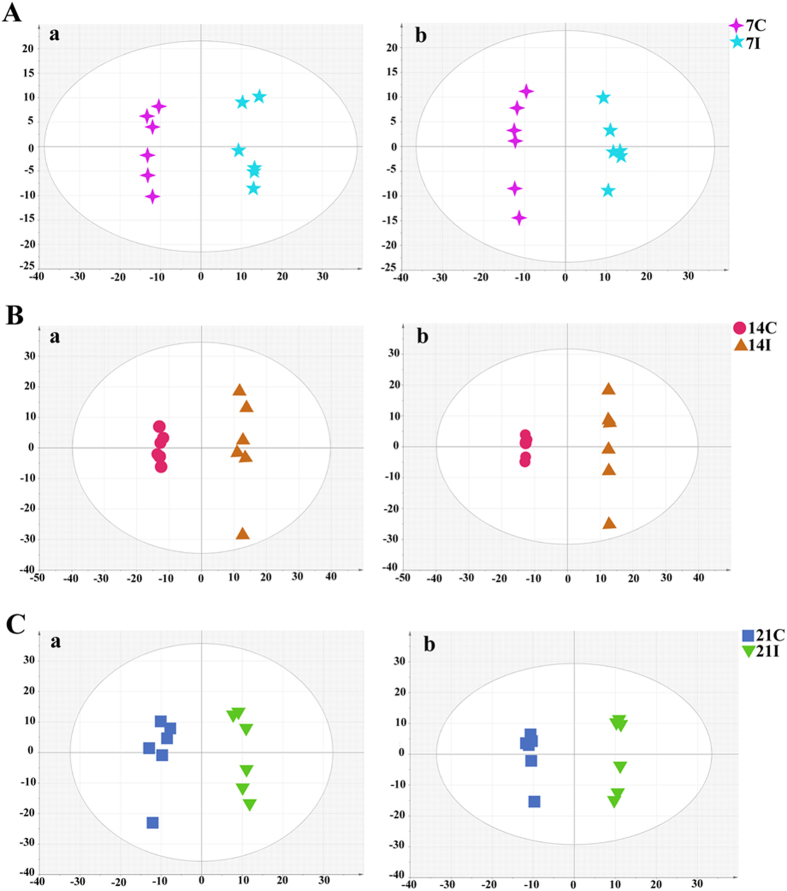
Figure 3. OPLS-DA score plot of T. gondii infected and control groups.
(A) The 7D infected group (7I) and the 7D control group (7C) (R2X = 0.427, R2Y = 0.985,Q2 = 0.829 ESI+; R2X = 0.392, R2Y = 0.987, Q2 = 0.801 ESI−); (B) The 14D infected group (14I) and the 14D control group (14C) (R2X = 0.699, R2Y = 0.996, Q2 = 0.934 ESI+; R2X = 0.771, R2Y = 1, Q2 = 0.944 ESI−); (C) The 21D infected group (21I) and the 21D control group (21C) (R2X = 0.506, R2Y = 0.975,Q2 = 0.877 ESI+; R2X = 0.505, R2Y = 0.997, Q2 = 0.852 ESI−). In the OPLS-DA score plot, each data point represents one mouse serum sample, and the distance between points in the plot indicates the similarity between samples. (a) ESI+; (b) ESI-. x- and y-axes represent PC1 and PC2, respectively.

