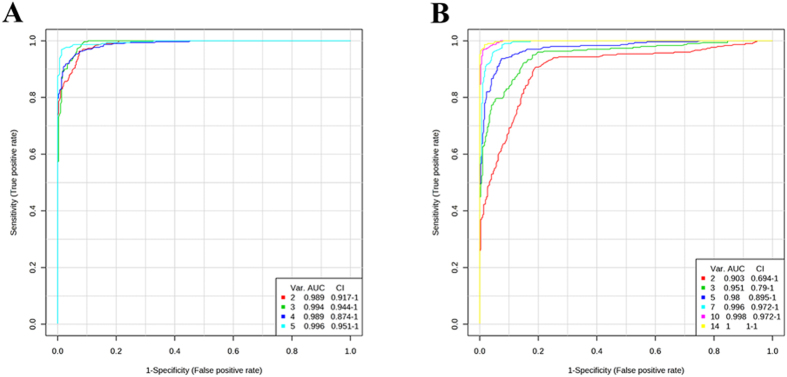
Figure 8. Comparisons of different matabolites panels based on ROC curves.
ROC curves are generated by Monte-Carlo cross validation (MCCV) using balanced subsampling. PLS-DA algorithm was selected as classification and feature ranking method. In each MCCV, two-thirds of the samples are used to evaluate the feature (metabolite) importance. Different panels of important features are then used to build classification models, which is validated on the one-third samples that were left out. The different models with specific feature numbers and their corresponding AUCs are shown on the figure. (A) Marker metabolites detected in ESI+ mode, (B) Maker metabolites detected in ESI- mode. Var. (variables) indicates the number of selected features.

