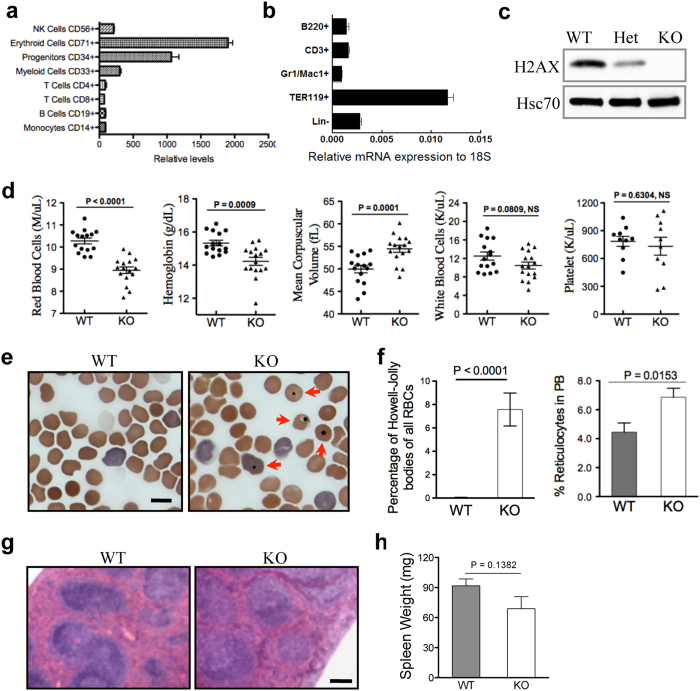
Figure 1. Macrocytic anaemia and increased Howell-Jolly bodies in H2AX-deficient mice.
(a,b) Relative H2AX mRNA expression in the indicated cells from humans (a) and mice (b). Data from human mRNA expression were obtained from the Scripps Research Institute BioGPS database43. B220, CD3, Gr1/Mac1, Ter119, and Lin- represent B cells, T cells, granulocytes, erythroid cells, and lineage-negative cells, respectively. (c) Western blot analysis of H2AX protein expression in mouse bone marrow cells. Hsc70 was used as a loading control. WT = wild-type, Het = heterozygous, KO = knockout. (d) Complete blood count. Each dot represents a single mouse (n = 16 per group, except n = 10 per group for platelet count) aged 6 to 8 weeks. (e) Representative micrographs of peripheral blood smears from H2AX knockout and wild-type mice. Arrows indicate red blood cells with Howell-Jolly bodies. Scale bar: 10 μm. (f) Quantification of red blood cells (RBCs) and peripheral blood (PB) reticulocytes with Howell-Jolly bodies in (e) (n = 3 per group). Data are shown as mean ± standard deviation (SD). (g) Hematoxylin and eosin staining of spleens from H2AX knockout and wild-type mice. Scale bar: 200 μm. (h) Quantification of spleen weight (n = 5 per group). Data are shown as mean ± SD.

