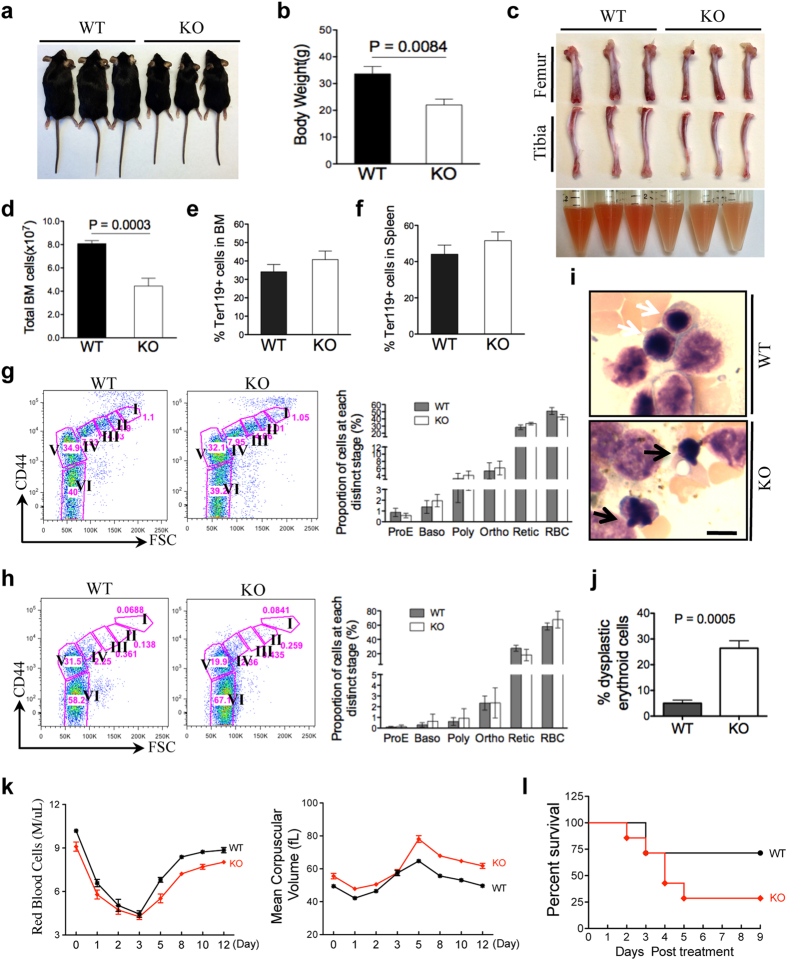
Figure 2. Dysplasia in late-stage terminal erythroblasts in H2AX knockout mice.
(a) Representative images of H2AX knockout and wild-type mice aged 8 to 12 weeks. (b) Quantification of body weight of mice in (a). Data are shown as mean ± SD. (c) Representative images of femurs and tibias from wild-type and H2AX knockout mice (upper panel). Images of bone marrow cells from two femurs and two tibias per mouse in 1 ml PBS (lower panel; left three tubes: WT, right three tubes: KO). (d) Quantification of mononuclear cells in the bone marrow of mice (n = 5 per group). Data are shown as mean ± SD. (e,f) Percentage of Ter119-positive cells in the bone marrow (BM; e) and spleen (f) was measured by flow cytometry (n = 5 per group). Data are shown as mean ± SD. (g,h) Flow cytometric analysis of CD44 and FSC levels of CD45-negative erythroblasts from the bone marrow (g) and spleen (h) of mice. Populations I–VI represent proerythroblasts, basophilic erythroblasts, polychromatic erythroblasts, orthochromatic erythroblasts, reticulocytes, and red blood cells, respectively. Quantification is shown to the right. (i) Wright-Giemsa staining of bone marrow smears from mice aged 8 to 12 weeks. White arrows indicate normal erythroblasts, and black arrows indicate dysplastic erythroblasts with nuclear budding. Scale bar: 10 μm. (j) Quantification of dysplastic erythroblasts in (i). Data are from 30 high-power bone marrow smear images (n = 3 per group) and are shown as mean ± SD. (k) H2AX knockout and wild-type mice were treated with PHZ (50 mg/kg at day 0), and peripheral blood (20 μl per mouse) was collected at the indicated time points. Red blood cells and mean corpuscular volume were measured using an automated hemovet (n = 9 per group). Data are shown as mean ± SD. (l) H2AX knockout and wild-type mice were treated with PHZ (100 mg/kg at day 0 and 50 mg/kg at day 1). Survival of recipients (n = 7 per group).

